Technical Analysis of ACIO 2024-05-31
Overview:
In analyzing the technical indicators for ACIO stock over the last 5 days, we will delve into the trends, momentum, volatility, and volume aspects to provide a comprehensive outlook on the possible stock price movement in the upcoming days. By examining key indicators such as moving averages, MACD, RSI, Stochastic Oscillator, Bollinger Bands, and OBV, we aim to offer valuable insights and predictions for informed decision-making.
Trend Analysis:
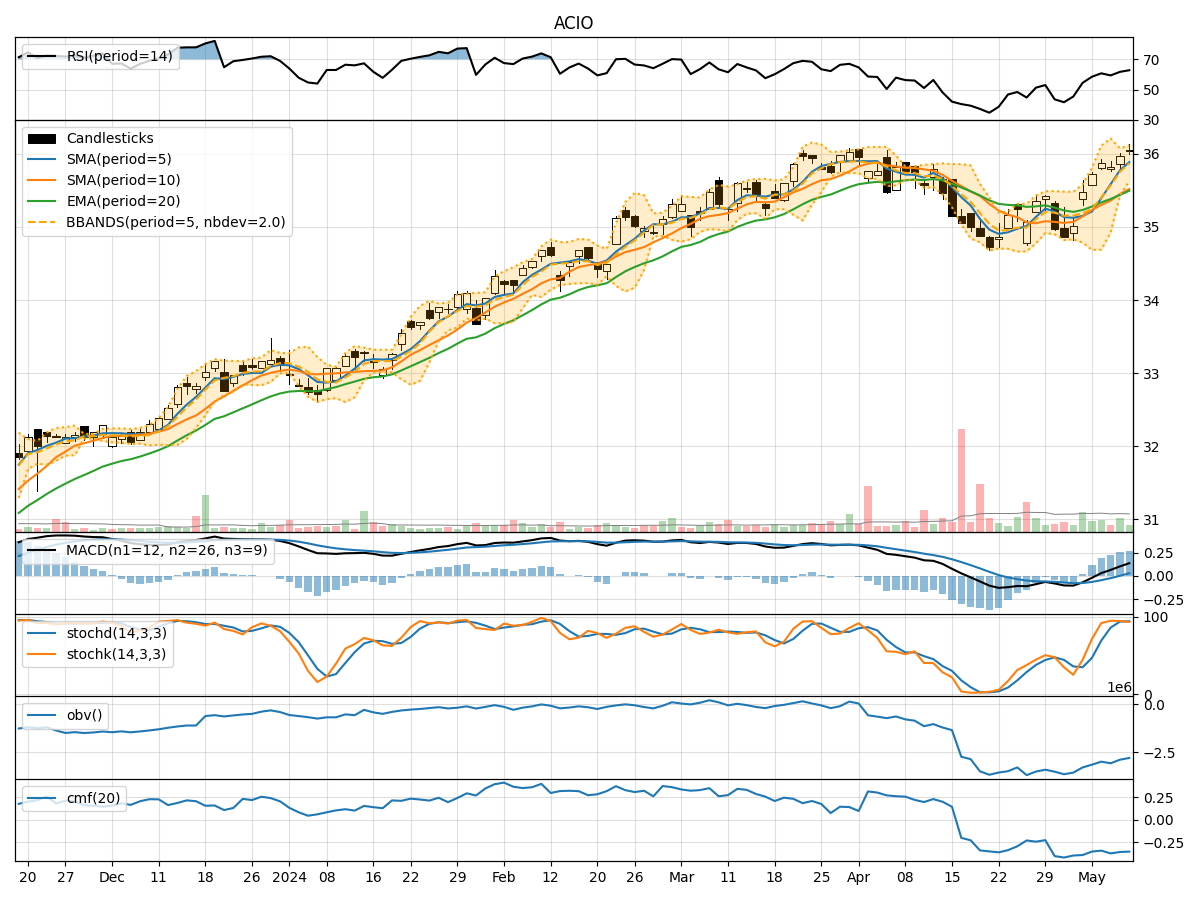
- Moving Averages (MA): The 5-day MA has been fluctuating around the closing prices, indicating short-term price trends. The SMA(10) and EMA(20) have shown slight variations but have not diverged significantly.
- MACD: The MACD line has been positive, indicating a bullish trend, although the MACD Histogram has shown a slight decrease in momentum.
Momentum Analysis:
- RSI: The RSI values have fluctuated within the neutral to overbought range, suggesting mixed momentum in the stock.
- Stochastic Oscillator: Both %K and %D values have been declining, indicating a potential shift towards oversold conditions.
Volatility Analysis:
- Bollinger Bands: The stock price has mostly remained within the Bollinger Bands, with the bands narrowing, suggesting decreased volatility.
Volume Analysis:
- On-Balance Volume (OBV): The OBV values have shown a slight decline, indicating some distribution of the stock.
- Chaikin Money Flow (CMF): The CMF has been positive, suggesting buying pressure in the stock.
Key Observations:
- The stock has been trading within a narrow range, with indicators showing mixed signals.
- The MACD and RSI indicate a slightly bullish sentiment, while the Stochastic Oscillator suggests a potential reversal.
- Volatility has decreased, as seen in the narrowing Bollinger Bands.
- The OBV decline hints at some selling pressure, although the CMF remains positive.
Conclusion:
Based on the analysis of the technical indicators, the stock price of ACIO is likely to experience a period of consolidation in the upcoming days. The mixed signals from the trend, momentum, volatility, and volume indicators suggest a lack of clear direction in the short term. Traders may expect the stock to trade sideways with limited price movements. It is advisable to closely monitor key support and resistance levels for potential breakout opportunities.