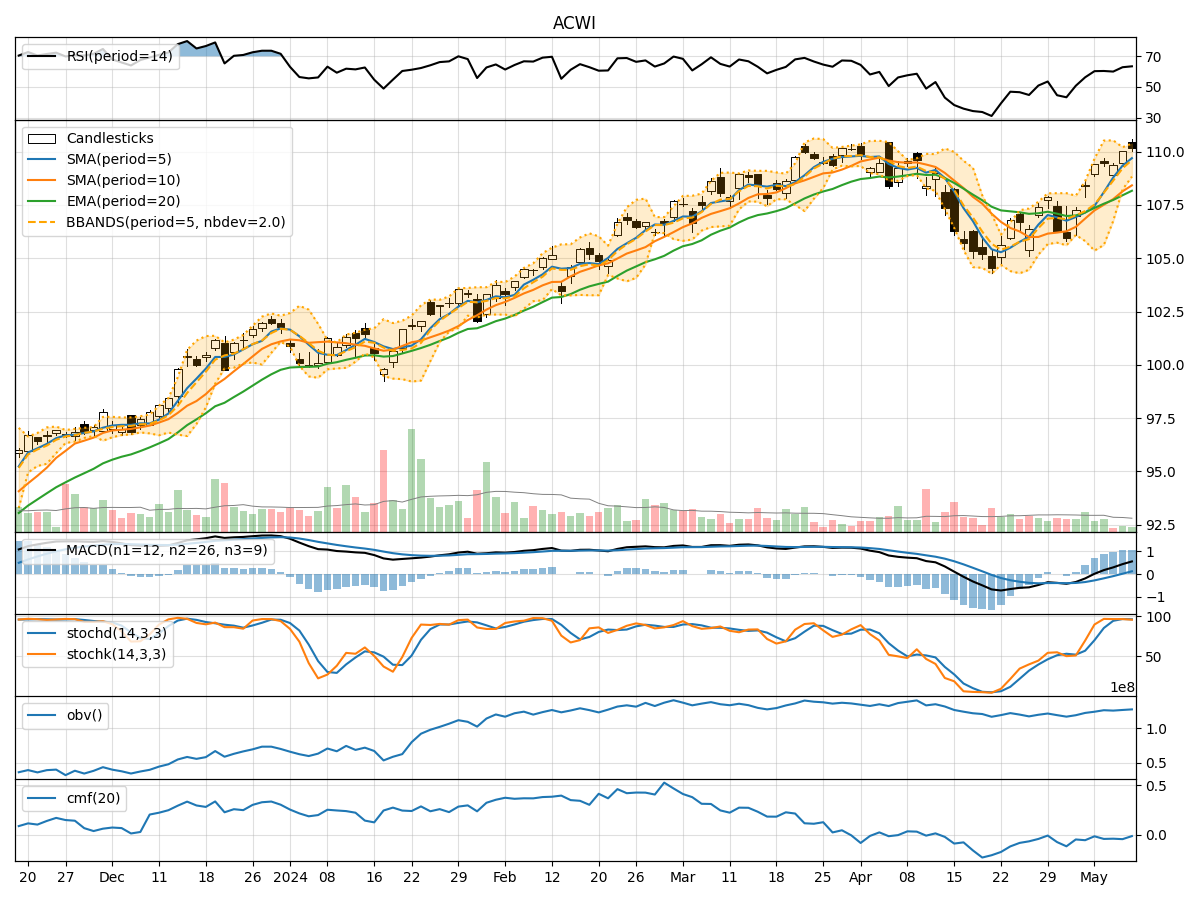
Technical Analysis of ACWI 2024-05-31
Overview:
In analyzing the technical indicators for the ACWI stock over the last 5 days, we will delve into the trends, momentum, volatility, and volume indicators to provide insights into the possible future stock price movements. By examining these key aspects, we aim to offer a comprehensive analysis and make informed predictions for the upcoming trading days.
Trend Analysis:
- Moving Averages (MA): The 5-day Moving Average (MA) has been fluctuating around the closing prices, indicating a relatively stable trend.
- MACD: The Moving Average Convergence Divergence (MACD) has shown a slight decrease over the past few days, suggesting a potential weakening of the bullish momentum.
- EMA: The Exponential Moving Average (EMA) has been relatively flat, indicating a lack of strong directional bias in the short term.
Momentum Analysis:
- RSI: The Relative Strength Index (RSI) has been fluctuating around the mid-level, indicating a neutral momentum.
- Stochastic Oscillator: Both %K and %D of the Stochastic Oscillator have been declining, signaling a potential bearish momentum.
- Williams %R: The Williams %R has been in oversold territory, suggesting a possible reversal in the short term.
Volatility Analysis:
- Bollinger Bands: The Bollinger Bands have been narrowing, indicating decreasing volatility in the stock price.
- Bollinger %B: The %B indicator has been hovering around the middle range, suggesting a lack of extreme price movements.
Volume Analysis:
- On-Balance Volume (OBV): The OBV has been fluctuating, indicating mixed buying and selling pressure.
- Chaikin Money Flow (CMF): The CMF has been relatively stable, showing a neutral flow of money into the stock.
Key Observations and Opinions:
- Trend: The trend indicators suggest a lack of strong directional bias, with a potential weakening of the bullish momentum.
- Momentum: The momentum indicators point towards a neutral to bearish sentiment in the short term.
- Volatility: Volatility has been decreasing, indicating a possible period of consolidation.
- Volume: The volume indicators show mixed signals, reflecting uncertainty in market participation.
Conclusion:
Based on the analysis of the technical indicators, the short-term outlook for the ACWI stock suggests a sideways movement with a slight bearish bias. Traders should exercise caution and closely monitor key support and resistance levels for potential entry and exit points. It is advisable to wait for clearer signals or confirmation of a new trend before making significant trading decisions.