Technical Analysis of AGIH 2024-05-31
Overview:
In analyzing the technical indicators for AGIH over the last 5 days, we will delve into the trend, momentum, volatility, and volume indicators to provide a comprehensive assessment of the stock's potential price movement. By examining these key factors, we aim to offer valuable insights and predictions for the next few days.
Trend Indicators:
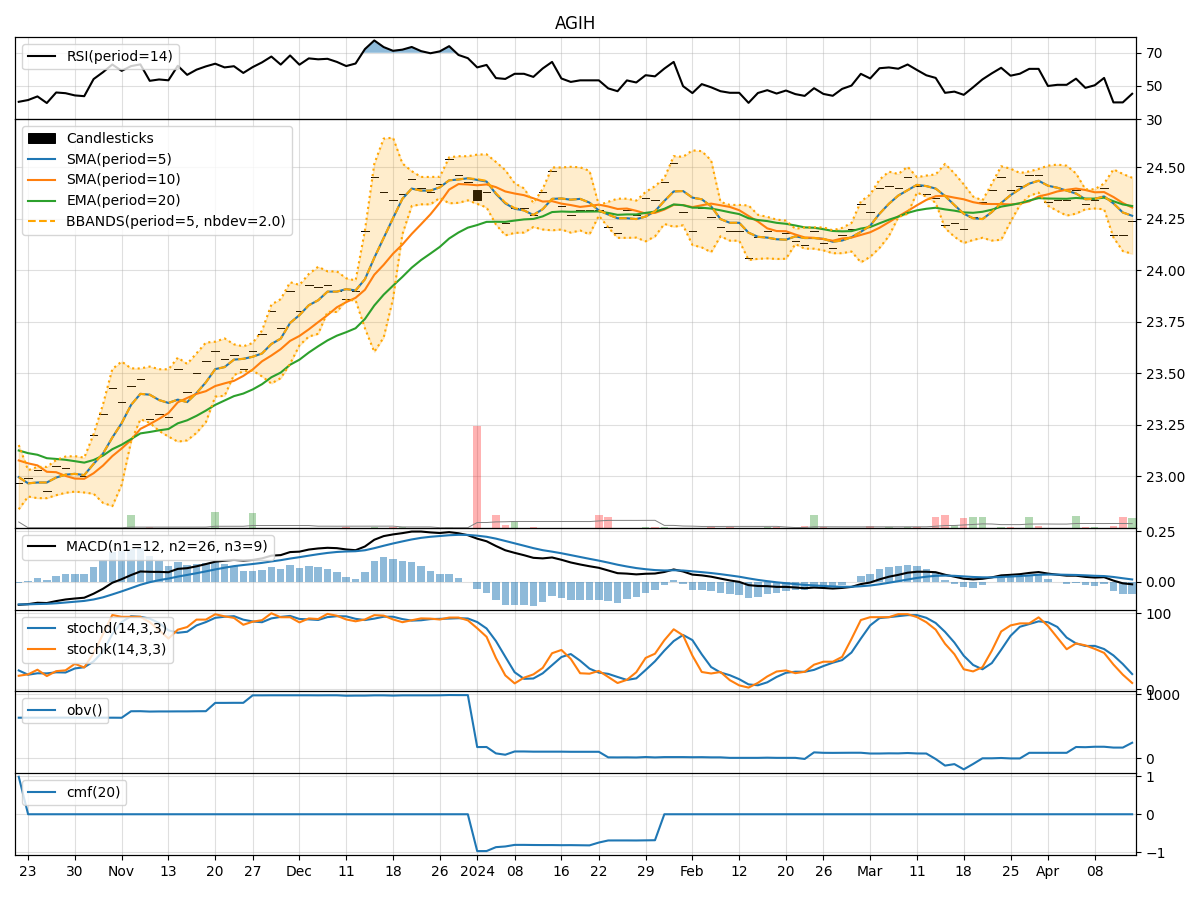
- Moving Averages (MA): The 5-day MA has been fluctuating around the closing prices, indicating a lack of clear trend direction.
- MACD: The MACD line has been positive but decreasing slightly, while the MACD Histogram has been moving towards the zero line, suggesting a potential weakening of bullish momentum.
Momentum Indicators:
- RSI: The RSI has been oscillating around the 50 level, indicating a neutral stance with no clear overbought or oversold conditions.
- Stochastic Oscillator: Both %K and %D have been fluctuating, showing indecision in momentum direction.
- Williams %R: The indicator has been hovering near oversold levels, suggesting a potential reversal in the short term.
Volatility Indicators:
- Bollinger Bands (BB): The stock price has been trading within the bands, with the bands narrowing, indicating decreasing volatility.
- Bollinger %B: The %B has been fluctuating around 0.5, suggesting a balanced market sentiment.
Volume Indicators:
- On-Balance Volume (OBV): The OBV has been relatively flat, indicating a lack of significant buying or selling pressure.
- Chaikin Money Flow (CMF): The CMF has been consistently at 0, reflecting a neutral money flow trend.
Key Observations and Opinions:
- Trend: The stock is currently in a sideways consolidation phase, with no clear trend direction.
- Momentum: Momentum indicators suggest a lack of strong buying or selling pressure, leading to indecision in the market.
- Volatility: Volatility has been decreasing, indicating a potential period of price stabilization.
- Volume: The volume indicators show limited participation from traders, contributing to the overall indecisiveness in the market sentiment.
Conclusion:
Based on the analysis of the technical indicators, the next few days for AGIH are likely to see continued sideways movement with limited volatility and lackluster volume. Traders should exercise caution and wait for clearer signals before taking significant positions. The stock is currently in a consolidation phase, and a breakout in either direction would require a catalyst to drive momentum. It is advisable to monitor key levels and wait for confirmation of a new trend before making trading decisions.