Technical Analysis of AIQ 2024-05-31
Overview:
In analyzing the technical indicators for the last 5 days of AIQ stock, we will delve into the trend, momentum, volatility, and volume indicators to provide a comprehensive outlook on the possible stock price movement in the coming days. By examining these key aspects, we aim to offer valuable insights and predictions to guide your investment decisions.
Trend Indicators:
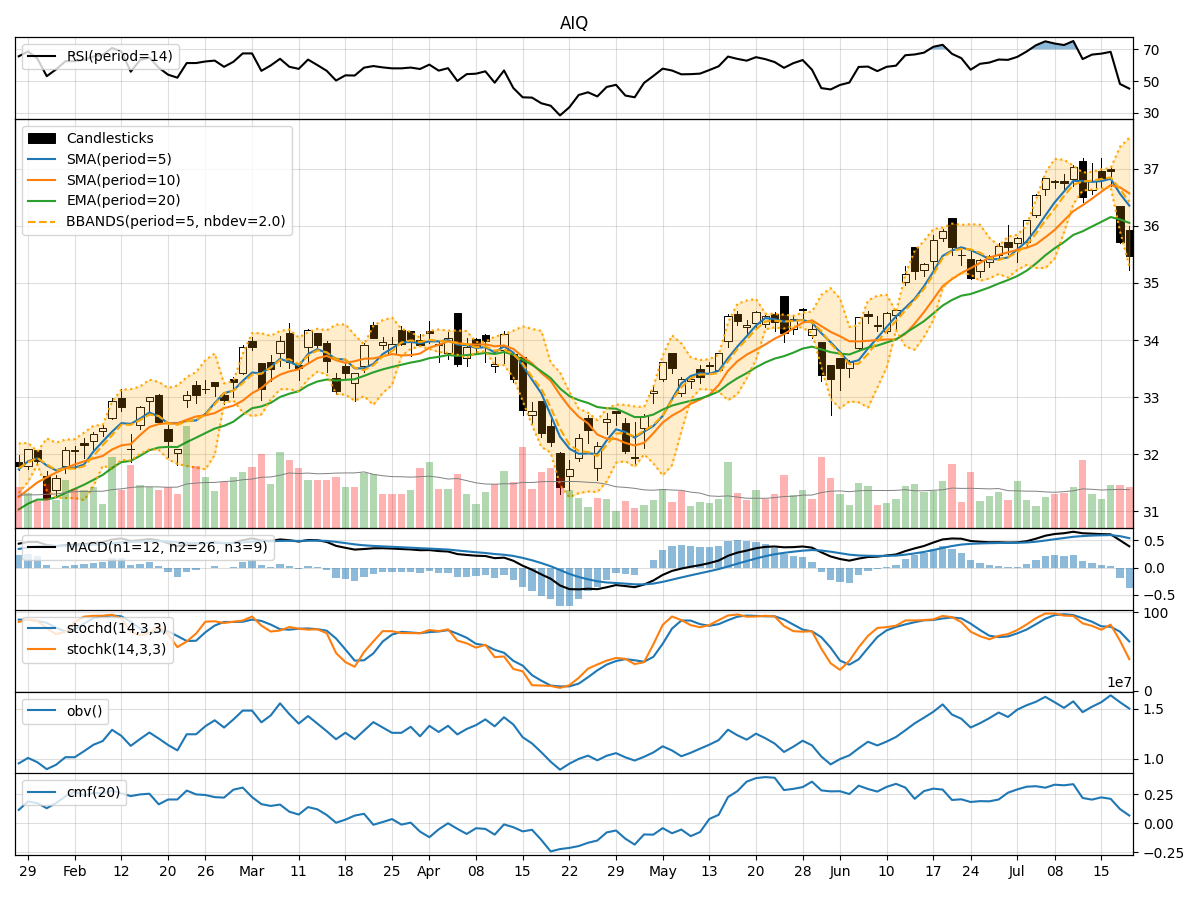
- Moving Averages (MA): The 5-day MA has been fluctuating around the closing prices, indicating short-term price trends. The SMA(10) and EMA(20) have shown a slight upward trend, suggesting a positive momentum in the medium to long term.
- MACD and Signal Line: The MACD has been positive for the past few days, indicating a bullish momentum. The MACD Histogram has been decreasing but remains above the signal line, signaling a potential consolidation phase.
Momentum Indicators:
- RSI: The RSI has been fluctuating in the neutral zone, indicating a lack of strong buying or selling pressure.
- Stochastic Oscillator: Both %K and %D have been declining, suggesting a bearish momentum. The stock is currently oversold based on the Stochastic indicator.
- Williams %R: The Williams %R is in the oversold territory, indicating a potential reversal in the short term.
Volatility Indicators:
- Bollinger Bands: The stock price has been trading within the Bollinger Bands, with the bands widening in the last few days, indicating increased volatility.
- Bollinger %B: The %B indicator is below 1, suggesting that the stock is trading below the lower Bollinger Band, indicating a possible oversold condition.
Volume Indicators:
- On-Balance Volume (OBV): The OBV has been declining, indicating a potential distribution phase where selling pressure is increasing.
- Chaikin Money Flow (CMF): The CMF has been positive but decreasing, suggesting that money flow into the stock is slowing down.
Conclusion:
Based on the analysis of the technical indicators, the stock is currently in a bearish phase with downward momentum. The trend indicators show a potential consolidation phase, while the momentum indicators signal a bearish sentiment. The volatility has increased, indicating potential price swings, and the volume indicators suggest a distribution phase.
In the coming days, it is likely that the stock price will continue to face downward pressure, possibly testing lower support levels. Investors should exercise caution and consider waiting for a more favorable entry point before considering any long positions. It is advisable to closely monitor the price action and key support levels for any signs of a potential reversal in the trend.
Remember, market dynamics can change rapidly, so it is essential to stay updated with the latest developments and adjust your strategy accordingly.