Technical Analysis of AMDY 2024-05-31
Overview:
In analyzing the technical indicators for AMDY over the last 5 days, we will delve into the trend, momentum, volatility, and volume indicators to provide a comprehensive outlook on the possible stock price movement in the coming days. By examining these key aspects, we aim to offer valuable insights and predictions to guide your investment decisions.
Trend Indicators:
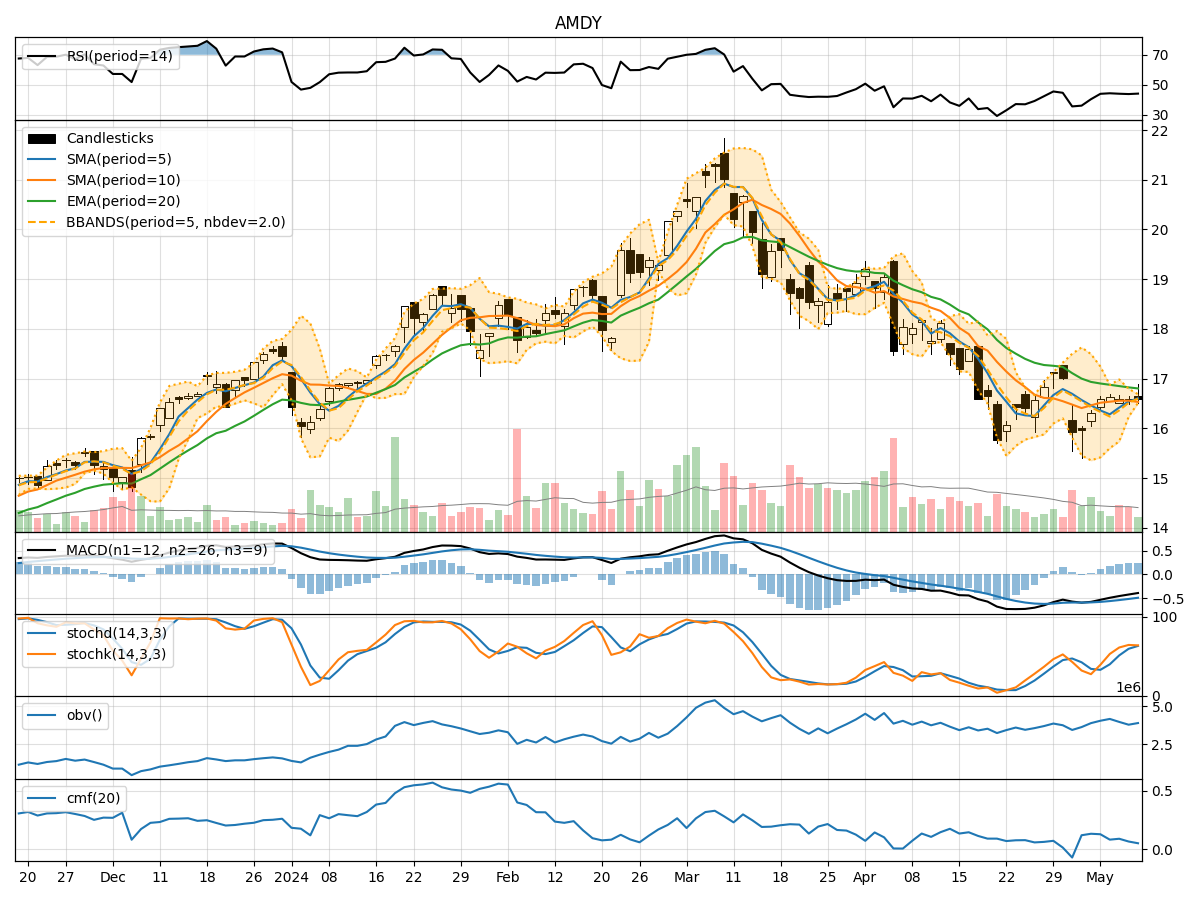
- Moving Averages (MA): The 5-day moving average has been consistently above the simple moving average (SMA) and exponential moving average (EMA), indicating a bullish trend.
- MACD: The MACD line has been consistently above the signal line, with the MACD histogram showing positive values, suggesting bullish momentum.
Momentum Indicators:
- RSI: The Relative Strength Index (RSI) has been fluctuating around the 50 level, indicating a neutral momentum.
- Stochastic Oscillator: Both %K and %D have been in the overbought zone, suggesting a potential reversal in momentum.
Volatility Indicators:
- Bollinger Bands: The stock price has been trading within the upper and lower Bollinger Bands, indicating a period of consolidation.
Volume Indicators:
- On-Balance Volume (OBV): The OBV has been fluctuating, suggesting indecision among investors.
- Chaikin Money Flow (CMF): The CMF has been positive, indicating buying pressure in the market.
Key Observations:
- The trend indicators suggest a bullish sentiment in the short term.
- Momentum indicators show a neutral stance with a potential reversal in momentum.
- Volatility indicators point towards a period of consolidation.
- Volume indicators reflect indecision among investors but with a slight buying pressure.
Conclusion:
Based on the analysis of the technical indicators, the next few days for AMDY could see sideways movement with a slight bullish bias. Traders should closely monitor the stochastic oscillator for any potential reversal in momentum. Additionally, keeping an eye on the RSI for confirmation of a sustained trend is crucial. The stock is likely to consolidate within the Bollinger Bands range, with intermittent bullish movements supported by positive OBV and CMF readings. Overall, a cautious approach with a focus on key support and resistance levels is recommended.