Technical Analysis of APRD 2024-05-31
Overview:
In analyzing the technical indicators for APRD over the last 5 days, we will delve into the trend, momentum, volatility, and volume indicators to provide a comprehensive outlook on the possible stock price movement in the coming days. By examining these key indicators, we aim to offer valuable insights and predictions for potential investors.
Trend Analysis:
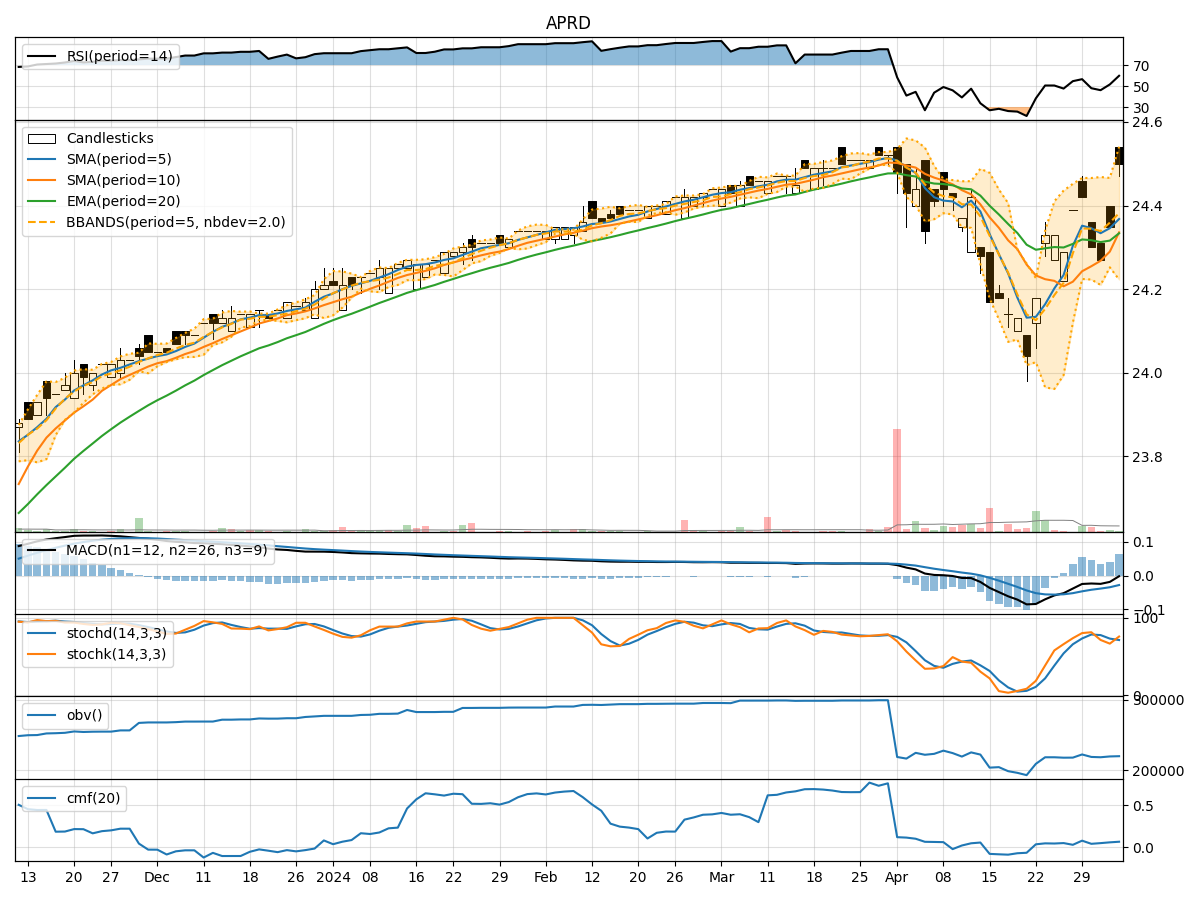
- Moving Averages (MA): The 5-day MA has been relatively stable around the closing prices, indicating a consistent trend.
- MACD: The MACD line has shown slight fluctuations but has generally remained positive, suggesting a bullish momentum.
- RSI: The RSI values have fluctuated but have generally stayed within the neutral to slightly overbought territory.
Key Observation: The trend indicators suggest a neutral to slightly bullish sentiment in the stock price movement.
Momentum Analysis:
- Stochastic Oscillator: Both %K and %D values have shown a decline, moving towards oversold levels.
- Williams %R: The Williams %R indicator has been fluctuating but is currently indicating an oversold condition.
Key Observation: Momentum indicators point towards a potential short-term bearish movement in the stock price.
Volatility Analysis:
- Bollinger Bands (BB): The stock price has mostly stayed within the Bollinger Bands, indicating a stable price range.
- BB %B: The %B values have fluctuated but have generally remained within the bands.
Key Observation: Volatility indicators suggest a period of consolidation or sideways movement in the stock price.
Volume Analysis:
- On-Balance Volume (OBV): The OBV values have shown a slight decline, indicating some selling pressure.
- Chaikin Money Flow (CMF): The CMF values have been negative, reflecting a lack of buying pressure.
Key Observation: Volume indicators suggest a bearish sentiment in terms of buying and selling pressure.
Conclusion:
Based on the analysis of the trend, momentum, volatility, and volume indicators, the overall outlook for APRD in the next few days leans towards a downward movement. The momentum indicators indicate a potential short-term bearish trend, supported by the volume indicators showing selling pressure. While the trend indicators suggest a neutral to slightly bullish sentiment, the overall market dynamics point towards a bearish bias.
Key Conclusion: The next few days are likely to see a downward movement in APRD's stock price, with a potential for consolidation or sideways movement within a defined price range. Investors should exercise caution and consider risk management strategies in their decision-making process.