Technical Analysis of ASHS 2024-05-31
Overview:
In analyzing the technical indicators for ASHS over the last 5 days, we will delve into the trend, momentum, volatility, and volume indicators to provide a comprehensive outlook on the possible stock price movement. By examining these key aspects, we aim to offer valuable insights and predictions for the upcoming days.
Trend Indicators:
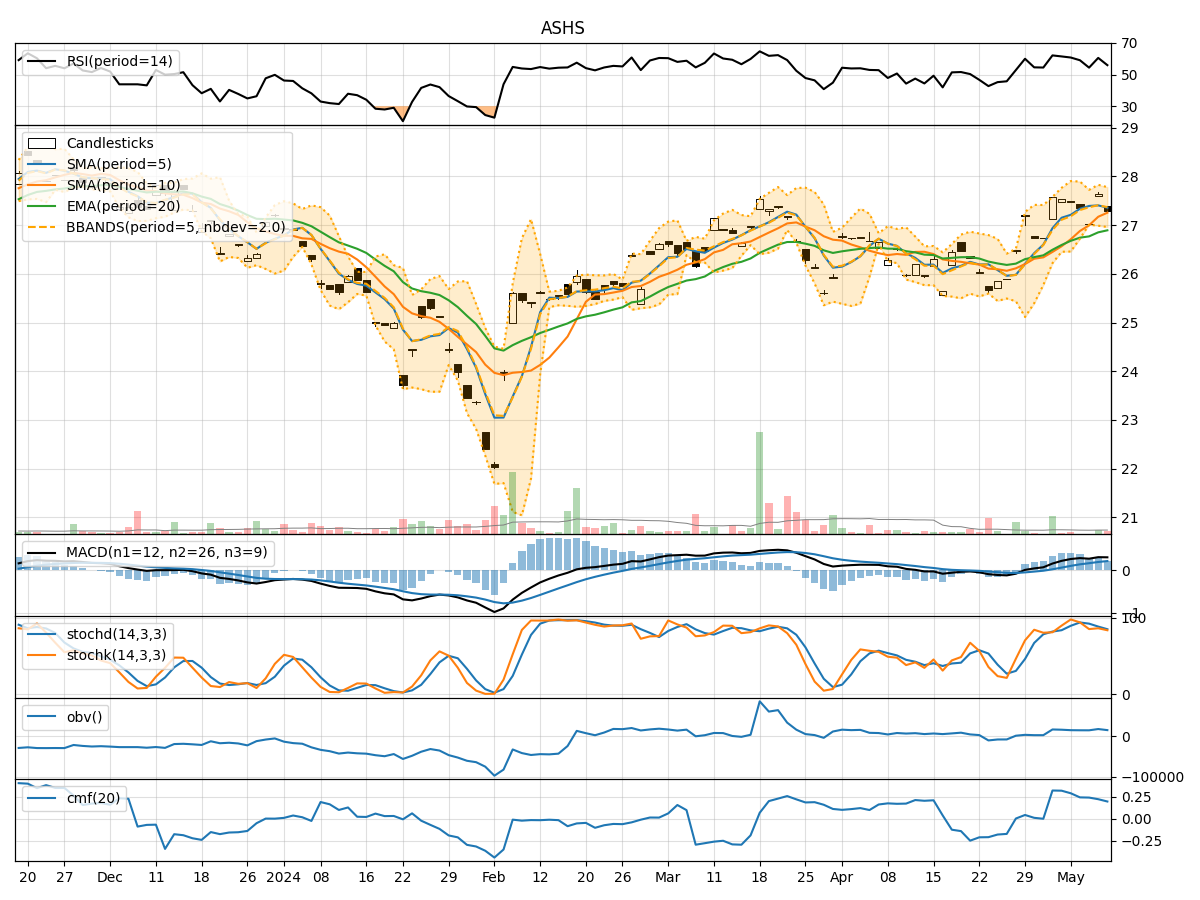
- Moving Averages (MA): The 5-day MA has been consistently below the closing prices, indicating a short-term downtrend.
- MACD: The MACD line has been decreasing, signaling a bearish momentum.
- MACD Histogram: The negative values of the MACD Histogram reinforce the bearish sentiment.
Momentum Indicators:
- RSI: The RSI values have been relatively low, suggesting a lack of strong buying momentum.
- Stochastic Oscillator: Both %K and %D values have been trending downwards, indicating weakening momentum.
- Williams %R: The values have been in oversold territory, reflecting a bearish sentiment.
Volatility Indicators:
- Bollinger Bands: The narrowing of the Bollinger Bands suggests decreasing volatility.
- Bollinger %B: The %B values have been below 0.5, indicating a potential oversold condition.
Volume Indicators:
- On-Balance Volume (OBV): The OBV values have been negative, indicating distribution.
- Chaikin Money Flow (CMF): The CMF values have been fluctuating around the zero line, reflecting a neutral sentiment.
Key Observations:
- The trend indicators, momentum indicators, and volume indicators all point towards a bearish sentiment in the short term.
- Volatility indicators suggest a decrease in volatility, potentially leading to a period of consolidation.
- The overall technical picture indicates a lack of strong buying interest and a prevailing bearish bias in the market sentiment.
Conclusion:
Based on the analysis of the technical indicators, the next few days for ASHS are likely to see further downward movement in stock prices. The bearish trend, weakening momentum, and negative volume signals all align to suggest a continuation of the current downtrend. Traders and investors should exercise caution and consider short-term selling strategies or staying on the sidelines until a clearer bullish reversal pattern emerges.