Technical Analysis of AUGW 2024-05-31
Overview:
In analyzing the technical indicators for AUGW over the last 5 days, we will delve into the trend, momentum, volatility, and volume indicators to provide a comprehensive outlook on the possible stock price movement. By examining these key aspects, we aim to offer valuable insights and predictions for the upcoming days.
Trend Analysis:
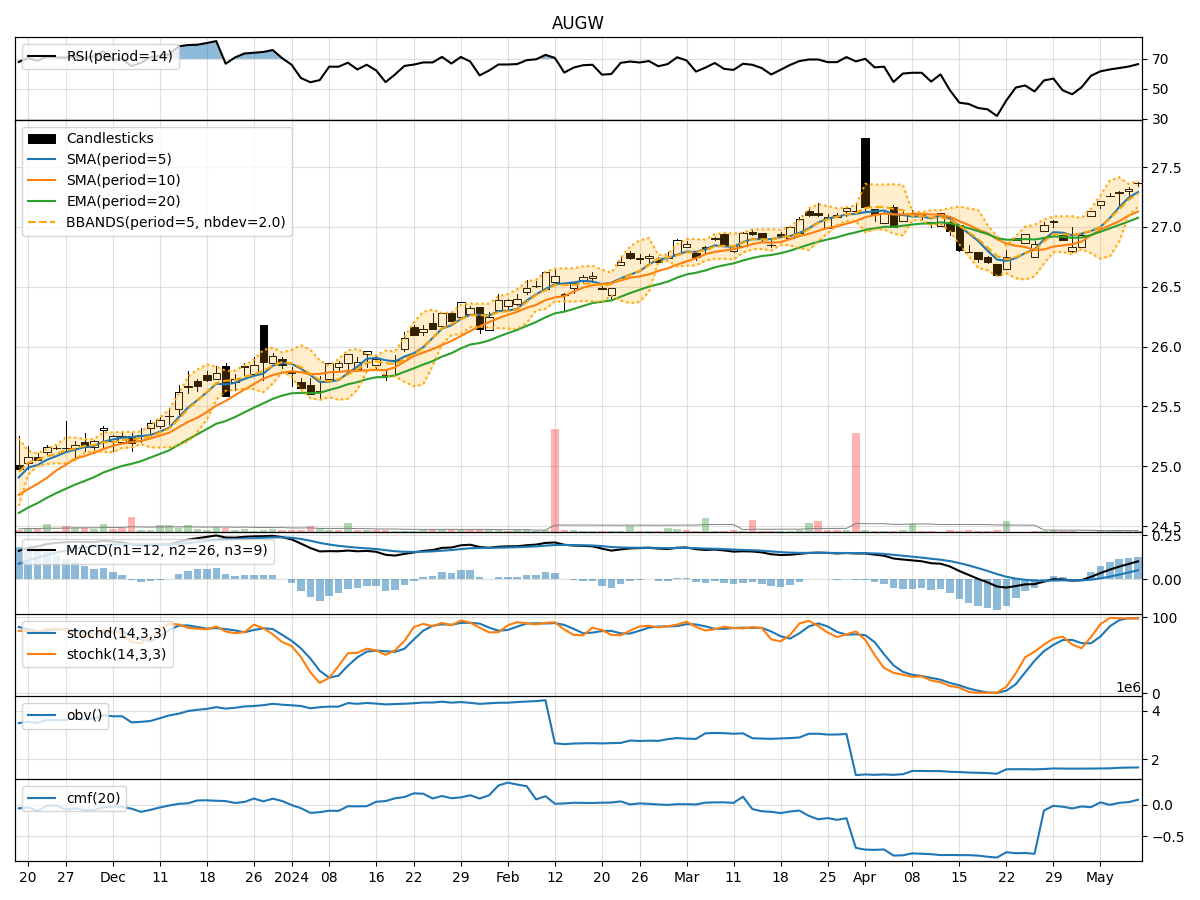
- Moving Averages (MA): The 5-day Moving Average (MA) has been relatively stable around the current stock price, indicating a neutral trend.
- MACD: The Moving Average Convergence Divergence (MACD) shows a slight positive momentum, with the MACD line above the signal line.
- EMA: The Exponential Moving Average (EMA) has been gradually increasing, suggesting a bullish sentiment in the short term.
Momentum Analysis:
- RSI: The Relative Strength Index (RSI) has been fluctuating around the neutral zone, indicating indecision among traders.
- Stochastic Oscillator: The Stochastic Oscillator shows a recent decline in momentum, moving towards oversold territory.
- Williams %R: The Williams %R indicator suggests that the stock may be oversold in the short term.
Volatility Analysis:
- Bollinger Bands: The Bollinger Bands have been narrowing, indicating decreasing volatility and a potential upcoming breakout.
- Bollinger %B: The %B indicator shows that the stock price is currently trading close to the lower band, signaling a possible oversold condition.
Volume Analysis:
- On-Balance Volume (OBV): The OBV indicator has been relatively stable, suggesting a balance between buying and selling pressure.
- Chaikin Money Flow (CMF): The CMF indicator shows a positive flow of money into the stock over the past 20 days, indicating potential bullish sentiment.
Key Observations:
- The trend indicators suggest a neutral to slightly bullish outlook in the short term.
- Momentum indicators show a mixed sentiment with a slight bearish bias.
- Volatility indicators point towards a potential breakout after a period of low volatility.
- Volume indicators indicate a balanced buying and selling pressure with a positive money flow into the stock.
Conclusion:
Based on the analysis of the technical indicators, the next few days for AUGW could see sideways consolidation with a slight bullish bias. Traders should monitor the breakout potential indicated by the narrowing Bollinger Bands and the positive money flow suggested by the CMF indicator. However, caution is advised due to the mixed momentum signals and the stock being close to oversold levels according to the Williams %R indicator. Overall, a cautiously optimistic approach is recommended for the upcoming trading sessions.