Technical Analysis of AVMC 2024-05-31
Overview:
In analyzing the technical indicators for AVMC over the last 5 days, we will delve into the trends, momentum, volatility, and volume aspects to provide a comprehensive outlook on the possible stock price movement in the coming days.
Trend Analysis:
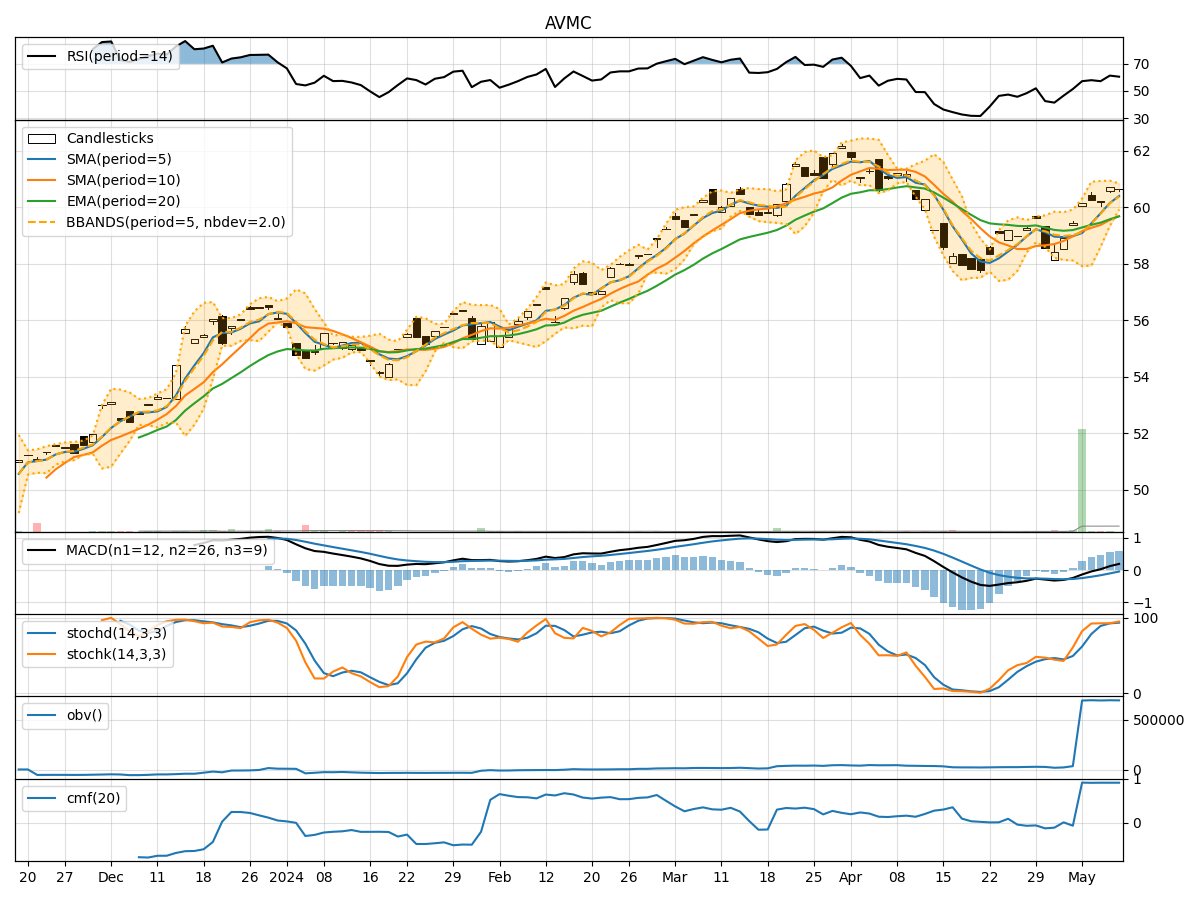
- Moving Averages (MA): The 5-day Moving Average (MA) has been fluctuating around the closing prices, indicating short-term price trends. The Simple Moving Average (SMA) and Exponential Moving Average (EMA) show a slight decline, suggesting a potential bearish sentiment.
- Moving Average Convergence Divergence (MACD): The MACD and Signal Line have been converging, indicating a possible reversal in the short-term trend. However, the MACD Histogram remains negative, signaling a bearish momentum.
Momentum Analysis:
- Relative Strength Index (RSI): The RSI has been fluctuating within the neutral zone, indicating indecision among traders. It is currently around 50, suggesting a balanced market sentiment.
- Stochastic Oscillator: Both %K and %D lines of the Stochastic Oscillator are below 50, indicating a bearish momentum. The Williams %R is also in the oversold territory, signaling a potential reversal.
Volatility Analysis:
- Bollinger Bands (BB): The Bollinger Bands have been narrowing, indicating decreasing volatility. The price has been trading within the bands, suggesting a period of consolidation.
- Bollinger Band %B (BB %B): The %B indicator is hovering around 0.5, reflecting a balanced market sentiment with no clear direction.
Volume Analysis:
- On-Balance Volume (OBV): The OBV has been relatively stable, indicating a balance between buying and selling pressure. This suggests that the volume has not significantly influenced the recent price movements.
- Chaikin Money Flow (CMF): The CMF has been fluctuating around 0.9, indicating strong buying pressure. This could potentially support a bullish outlook in the near term.
Conclusion:
Based on the analysis of the technical indicators, the stock of AVMC is currently exhibiting mixed signals. The trend indicators suggest a slight bearish sentiment, while the momentum indicators show a neutral to bearish outlook. The volatility indicators point towards a period of consolidation, and the volume indicators indicate a balanced market sentiment.
Overall Assessment:
- Trend: Slightly Bearish
- Momentum: Neutral to Bearish
- Volatility: Consolidation
- Volume: Balanced
Forecast:
Considering the mixed signals from the technical indicators, it is likely that AVMC will experience a period of consolidation in the coming days. Traders should exercise caution and closely monitor key support and resistance levels for potential breakout opportunities. It is advisable to wait for clearer signals before taking significant trading positions.
Key Takeaway:
The market dynamics for AVMC are currently uncertain, and a cautious approach is recommended. It is essential to consider broader market trends and potential catalysts that could influence the stock price movement. Stay vigilant and adapt your trading strategy accordingly to navigate the evolving market conditions.