Technical Analysis of BAMD 2024-05-31
Overview:
In analyzing the technical indicators for BAMD over the last 5 days, we will delve into the trend, momentum, volatility, and volume indicators to provide a comprehensive outlook on the possible stock price movement in the coming days. By examining these key aspects, we aim to offer valuable insights and predictions for potential investors.
Trend Analysis:
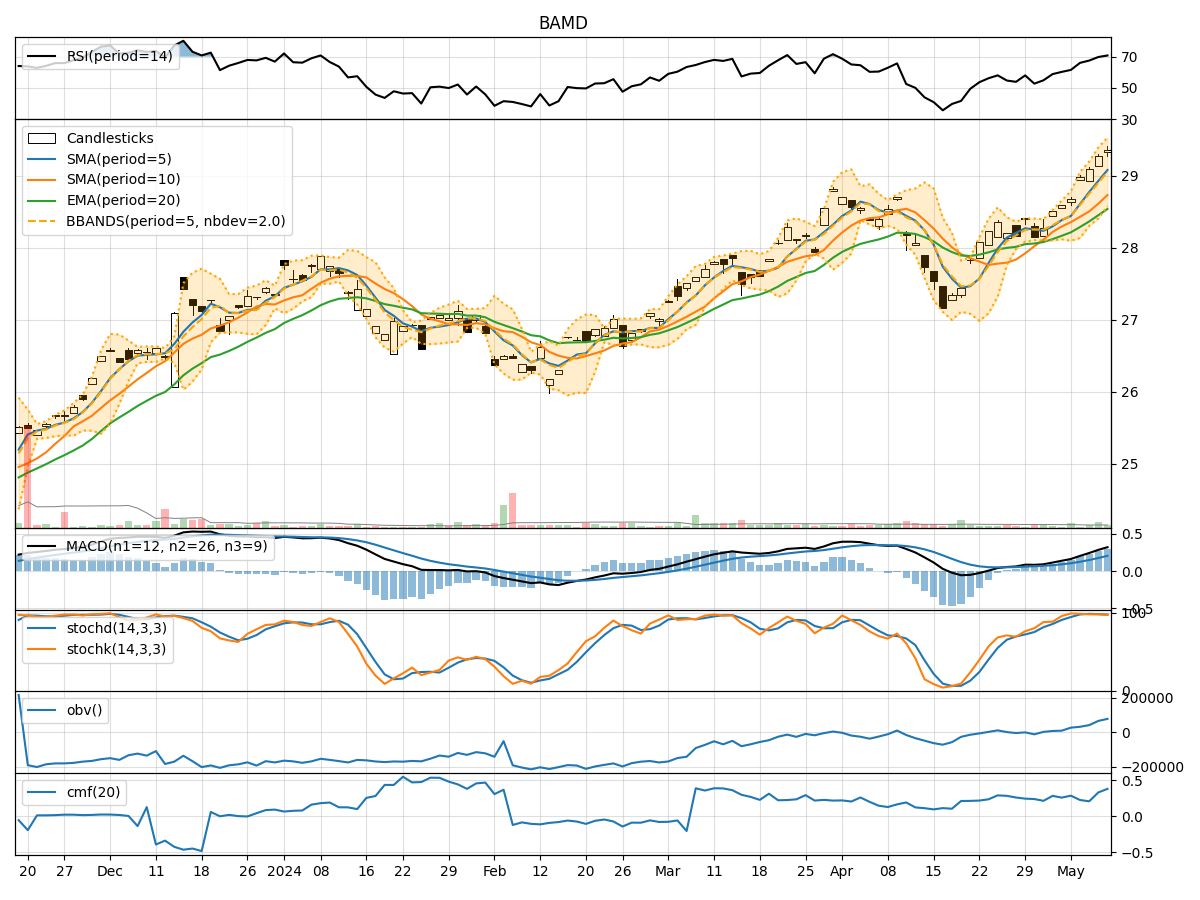
- Moving Averages (MA): The 5-day MA has been fluctuating around the actual closing prices, indicating a lack of clear trend direction.
- MACD: The MACD line has been consistently positive, suggesting a bullish momentum in the short term.
- EMA: The EMA has been relatively stable, reflecting a moderate trend in the stock price.
Key Observation: The trend indicators show mixed signals with a slight bullish bias due to the positive MACD line.
Momentum Analysis:
- RSI: The RSI values have been fluctuating around the mid-level, indicating a neutral momentum in the stock.
- Stochastic Oscillator: Both %K and %D values have been oscillating, reflecting indecision in the momentum.
- Williams %R: The Williams %R values have been mostly negative, suggesting a potential oversold condition.
Key Observation: The momentum indicators suggest a lack of clear direction, with a slight inclination towards a neutral to bearish momentum.
Volatility Analysis:
- Bollinger Bands (BB): The stock price has been trading within the Bollinger Bands, indicating a stable price range.
- Bollinger %B: The %B values have been fluctuating around the mid-level, suggesting balanced volatility.
- Average True Range (ATR): The ATR values have been relatively low, indicating subdued volatility in the stock.
Key Observation: Volatility indicators point towards a stable price range with no significant spikes expected in the near term.
Volume Analysis:
- On-Balance Volume (OBV): The OBV values have shown a slight decrease, indicating a potential distribution phase.
- Chaikin Money Flow (CMF): The CMF values have been fluctuating around the zero line, suggesting a balance between buying and selling pressure.
Key Observation: Volume indicators hint at a neutral sentiment with a slight bias towards distribution.
Conclusion:
Based on the analysis of the technical indicators, the stock of BAMD is likely to experience sideways movement in the coming days. The mixed signals from trend, momentum, volatility, and volume indicators suggest a lack of clear direction in the stock price. Investors should exercise caution and closely monitor any developments that may provide clearer signals for potential price movements.
Recommendation:
Given the current market dynamics and the technical indicators' readings, it is advisable to wait for more clarity before making any significant trading decisions. Monitoring key levels and waiting for a clearer trend to emerge would be prudent in this scenario.