Technical Analysis of BBLB 2024-05-31
Overview:
In analyzing the technical indicators for BBLB over the last 5 days, we will delve into the trend, momentum, volatility, and volume indicators to provide a comprehensive outlook on the possible stock price movement. By examining these key aspects, we aim to offer valuable insights and predictions for the upcoming days.
Trend Indicators:
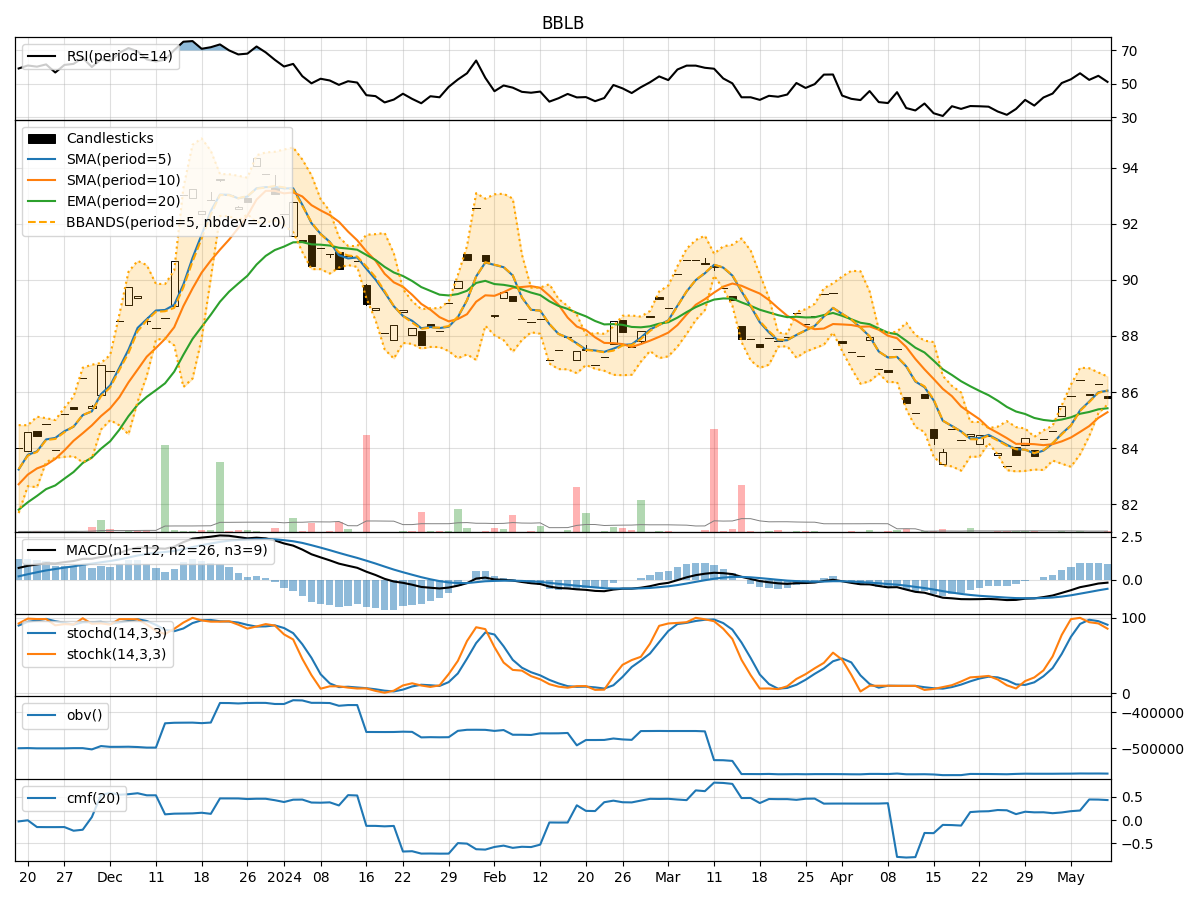
- Moving Averages (MA): The 5-day MA has been fluctuating around the closing prices, indicating short-term price trends. The SMA(10) and EMA(20) have shown a slight decline, suggesting a potential weakening trend.
- MACD: The MACD line has been hovering around the signal line, with the MACD histogram showing a decreasing trend, signaling a potential bearish momentum.
Momentum Indicators:
- RSI: The RSI has been oscillating around the 50 level, indicating a neutral momentum in the stock.
- Stochastic Oscillator: Both %K and %D have been trending downwards, suggesting a bearish momentum.
Volatility Indicators:
- Bollinger Bands (BB): The stock price has been trading within the bands, with the lower band acting as a support level. The narrowing of the bands indicates decreasing volatility.
Volume Indicators:
- On-Balance Volume (OBV): The OBV has been fluctuating, indicating indecision among investors regarding the stock.
- Chaikin Money Flow (CMF): The CMF has been positive but relatively stable, suggesting a neutral sentiment towards the stock.
Key Observations:
- The trend indicators show a potential weakening trend, with the MACD signaling a bearish momentum.
- Momentum indicators point towards a bearish sentiment, with both RSI and Stochastic Oscillator trending downwards.
- Volatility has been decreasing, as indicated by the narrowing Bollinger Bands.
- Volume indicators reflect indecision among investors, with OBV fluctuating and CMF showing a neutral sentiment.
Conclusion:
Based on the analysis of the technical indicators, the outlook for BBLB in the next few days is bearish. The weakening trend, bearish momentum, decreasing volatility, and neutral volume indicators suggest a potential downward movement in the stock price. Traders and investors should exercise caution and consider short-term selling opportunities or wait for a clearer trend reversal signal before considering long positions.