Technical Analysis of BBP 2024-05-31
Overview:
In analyzing the technical indicators for BBP stock over the last 5 days, we will delve into the trends, momentum, volatility, and volume aspects to provide a comprehensive outlook on the possible stock price movement in the coming days. By examining key indicators such as moving averages, MACD, RSI, Bollinger Bands, and OBV, we aim to offer valuable insights and predictions for potential price action.
Trend Analysis:
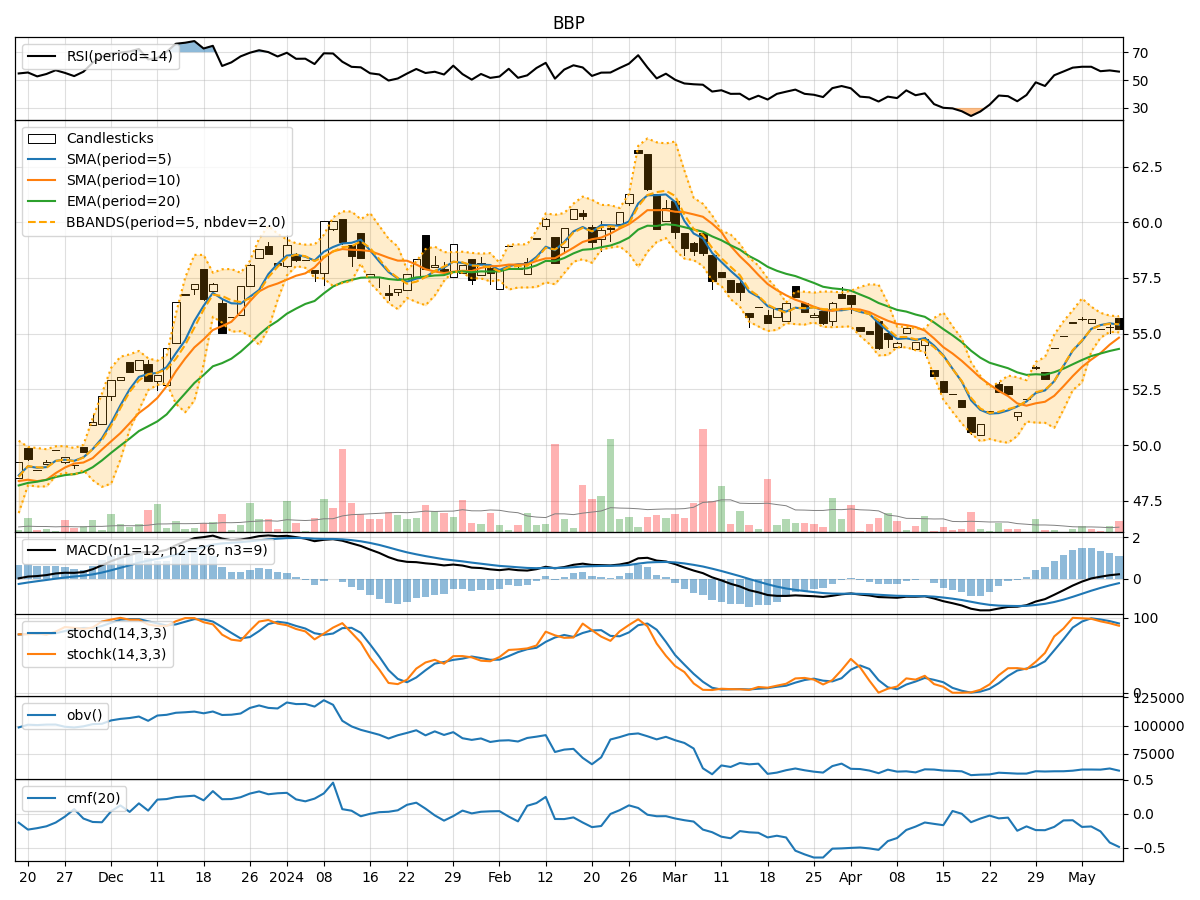
- Moving Averages (MA): The 5-day MA has been fluctuating around the closing prices, indicating short-term price trends. The SMA(10) and EMA(20) have shown slight variations but have generally been close to the closing prices.
- MACD: The MACD line has been positive, indicating a bullish trend, with the MACD histogram showing small fluctuations around the zero line.
- Conclusion: The trend indicators suggest a neutral to slightly bullish outlook for the stock.
Momentum Analysis:
- RSI: The RSI values have been fluctuating around the mid-level, indicating a lack of strong momentum in either direction.
- Stochastic Oscillator: The Stochastics have shown mixed signals, with some days indicating overbought conditions and others oversold.
- Conclusion: The momentum indicators suggest a sideways to slightly bearish momentum for the stock.
Volatility Analysis:
- Bollinger Bands: The BBP(5,2.0) values have been fluctuating within the bands, with the BBP indicator showing values around 0.5, indicating moderate volatility.
- Conclusion: The volatility indicators suggest a stable but moderately volatile environment for the stock.
Volume Analysis:
- On-Balance Volume (OBV): The OBV values have been fluctuating negatively, indicating some selling pressure in the stock.
- Chaikin Money Flow (CMF): The CMF values have been consistently negative, indicating a lack of buying pressure.
- Conclusion: The volume indicators suggest a bearish sentiment in terms of volume flow.
Overall Conclusion:
Based on the analysis of trend, momentum, volatility, and volume indicators, the overall outlook for BBP stock in the next few days leans towards a sideways to slightly bearish movement. While the trend indicators show a neutral to slightly bullish stance, the momentum and volume indicators point towards a lack of strong buying interest and some selling pressure. The volatility remains moderate, suggesting potential price swings within a stable range.
Recommendation:
Considering the mixed signals from the technical indicators, it is advisable for investors to exercise caution and closely monitor the stock's price action in the coming days. It may be prudent to wait for clearer signals or confirmation of a trend before making significant trading decisions. Additionally, keeping an eye on any fundamental developments that could impact the stock's performance is crucial for a well-rounded investment strategy.