Technical Analysis of BFOR 2024-05-31
Overview:
In analyzing the technical indicators for BFOR over the last 5 days, we will delve into the trend, momentum, volatility, and volume indicators to provide a comprehensive outlook on the possible stock price movement in the coming days. By examining these key aspects, we aim to offer valuable insights and predictions to guide your investment decisions.
Trend Indicators Analysis:
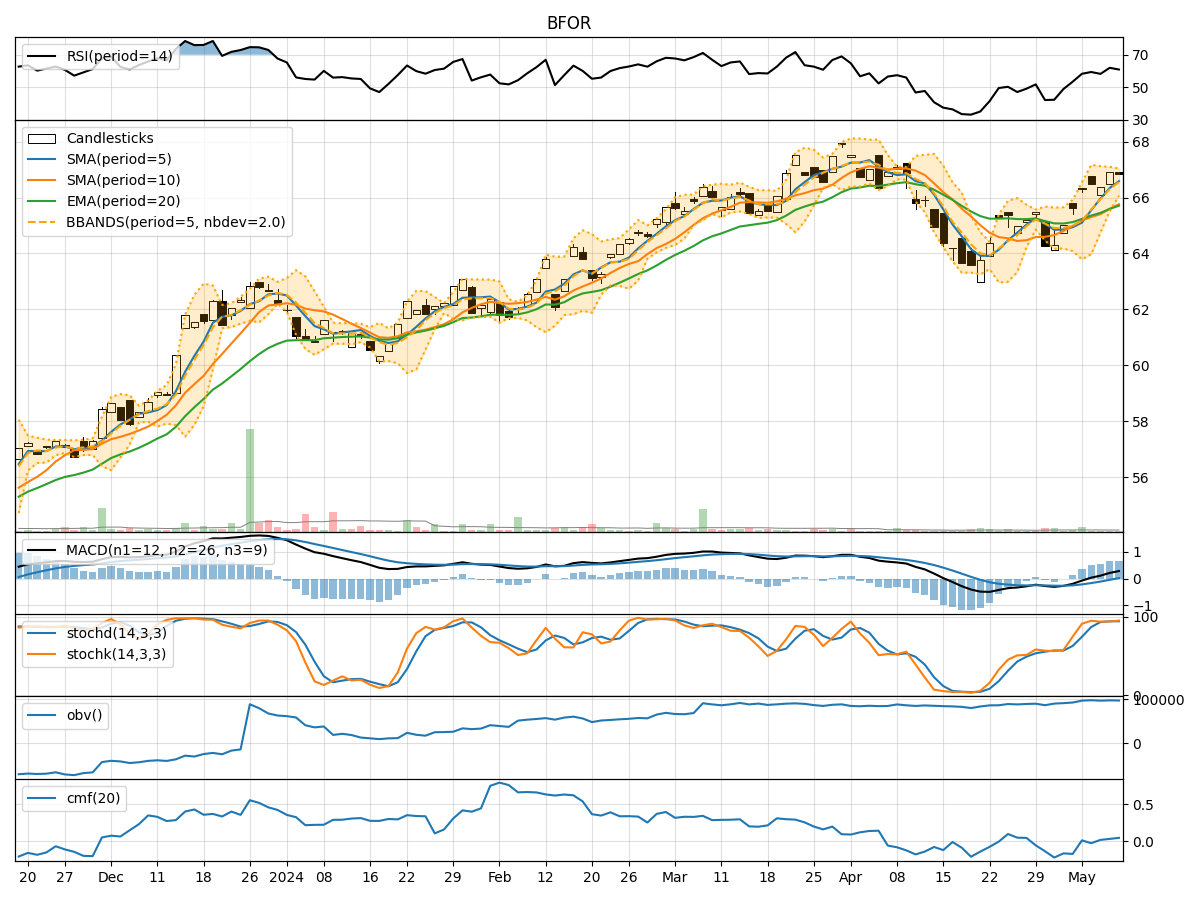
- Moving Averages (MA): The 5-day MA has been fluctuating around the closing prices, indicating a lack of clear trend direction.
- MACD: The MACD line has been hovering around the signal line, suggesting a neutral momentum in the short term.
- RSI: The RSI values have been oscillating around the mid-level, reflecting a balanced buying and selling pressure.
Momentum Indicators Analysis:
- Stochastic Oscillator: Both %K and %D values have been declining, indicating a bearish momentum.
- Williams %R: The indicator has been in oversold territory, signaling a potential reversal or consolidation phase.
Volatility Indicators Analysis:
- Bollinger Bands (BB): The bands have been narrowing, suggesting decreasing volatility and a possible period of consolidation.
- Average True Range (ATR): ATR values have been relatively stable, indicating a lack of significant price fluctuations.
Volume Indicators Analysis:
- On-Balance Volume (OBV): The OBV has been fluctuating, reflecting mixed buying and selling pressure.
- Chaikin Money Flow (CMF): The CMF values have been negative, indicating a net outflow of money from the stock.
Key Observations and Opinions:
- Trend: The stock is currently lacking a clear trend direction, with moving averages and MACD signaling neutrality.
- Momentum: The bearish momentum indicated by the Stochastic Oscillator suggests a potential downward movement.
- Volatility: The narrowing Bollinger Bands and stable ATR point towards a period of consolidation.
- Volume: Mixed OBV and negative CMF values indicate uncertainty and potential selling pressure.
Conclusion:
Based on the analysis of the technical indicators, the next few days for BFOR are likely to see sideways movement with a slight bearish bias. The lack of a clear trend, coupled with bearish momentum and mixed volume signals, suggests a period of consolidation or minor downward pressure. Traders should exercise caution and consider waiting for more definitive signals before making significant trading decisions.