Technical Analysis of BMED 2024-05-31
Overview:
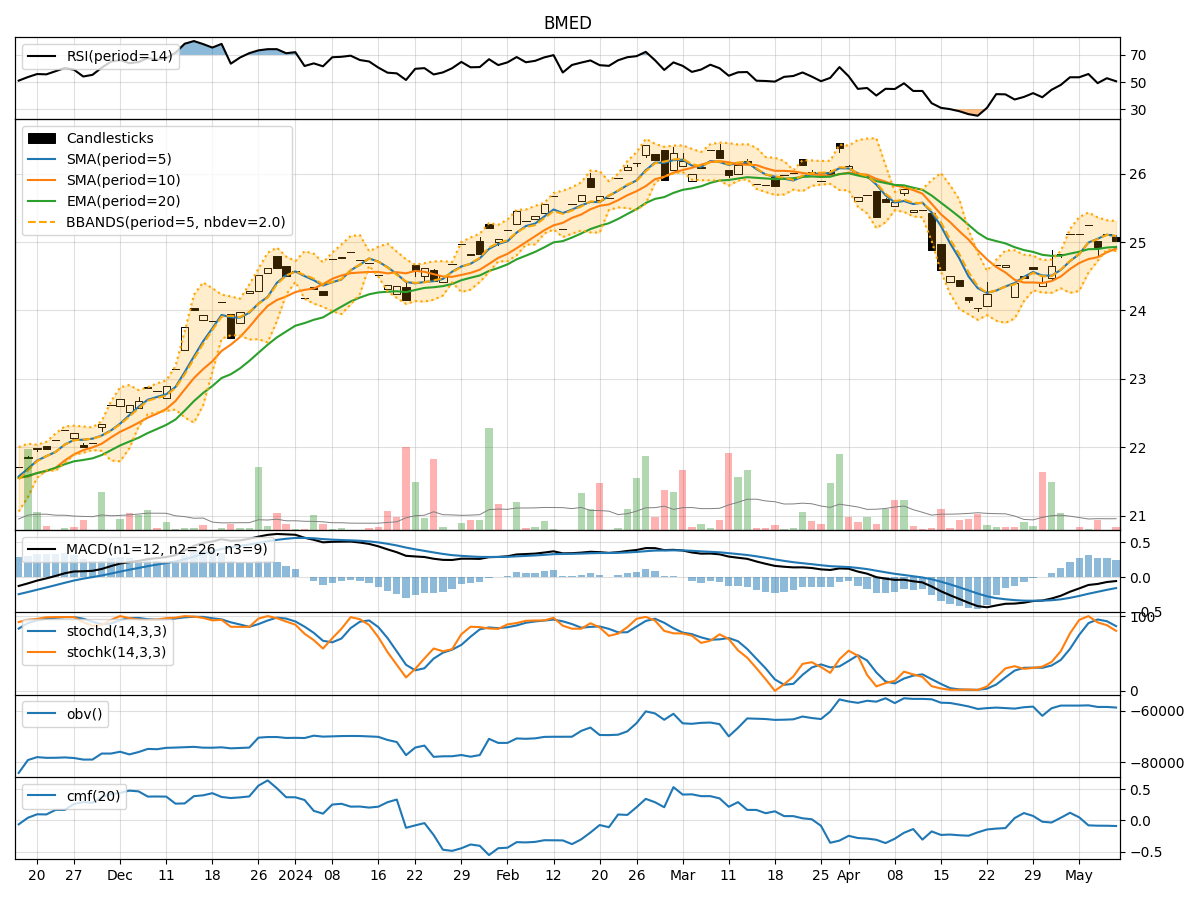
In the last 5 trading days, BMED stock has shown a downward trend in its closing price, accompanied by fluctuating volume levels. The trend indicators, momentum indicators, volatility indicators, and volume indicators provide valuable insights into the stock's potential future movements. Let's analyze each category of indicators to determine the possible stock price movement in the next few days.
Trend Indicators:
- Moving Averages (MA): The 5-day MA has been consistently below the closing price, indicating a short-term bearish trend.
- MACD: The MACD line has been negative, suggesting a bearish momentum in the stock price.
- MACD Histogram: The negative values of the MACD histogram indicate a decreasing bearish momentum.
Momentum Indicators:
- RSI: The RSI values have been declining, indicating a weakening momentum in the stock price.
- Stochastic Oscillator: Both %K and %D values have been relatively low, suggesting a potential oversold condition.
- Williams %R: The Williams %R values have been consistently in the oversold territory, indicating a bearish sentiment.
Volatility Indicators:
- Bollinger Bands (BB): The stock price has been trading within the lower Bollinger Band, indicating a potential oversold condition.
- Bollinger Band Width: The narrowing of the Bollinger Band width suggests decreasing volatility in the stock price.
Volume Indicators:
- On-Balance Volume (OBV): The OBV values have been fluctuating, indicating indecision among market participants.
- Chaikin Money Flow (CMF): The CMF values have been mostly negative, suggesting a bearish money flow in the stock.
Key Observations and Opinions:
- The trend indicators, momentum indicators, and volume indicators collectively suggest a bearish sentiment in the stock.
- The volatility indicators indicate a potential oversold condition, which could lead to a short-term price bounce.
- The declining RSI and stochastic values indicate a weakening momentum, supporting the bearish view.
Conclusion:
Based on the analysis of the technical indicators, the next few days' possible stock price movement for BMED is likely to continue in a downward direction. The bearish trend, coupled with weakening momentum and negative money flow, indicates a challenging period for the stock. Traders and investors should exercise caution and consider waiting for a more favorable entry point before considering any long positions.