Technical Analysis of BMVP 2024-05-31
Overview:
In analyzing the provided Technical Analysis (TA) data for the last 5 days, we will delve into the trend, momentum, volatility, and volume indicators to forecast the possible stock price movement for the next few days. By examining these key indicators, we aim to provide a comprehensive and insightful analysis to guide your decision-making process.
Trend Indicators:
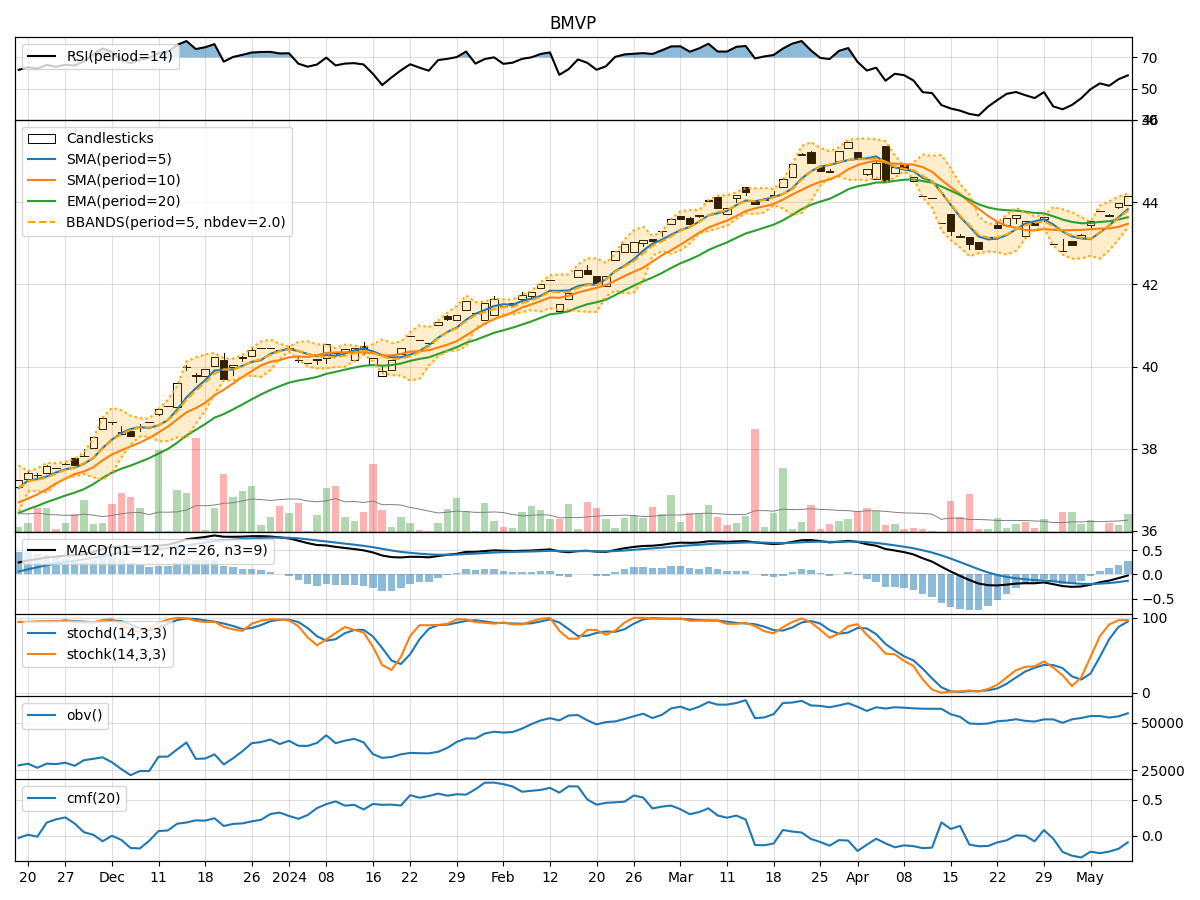
- Moving Averages (MA): The 5-day MA has been gradually decreasing, indicating a short-term bearish trend.
- MACD (Moving Average Convergence Divergence): The MACD line has been consistently below the signal line, suggesting a bearish momentum.
- EMA (Exponential Moving Average): The EMA has been declining, reinforcing the bearish sentiment in the short to medium term.
Momentum Indicators:
- RSI (Relative Strength Index): The RSI has been fluctuating but is currently in the neutral zone, indicating a lack of strong momentum.
- Stochastic Oscillator: Both %K and %D have been trending downwards, signaling weakening momentum.
- Williams %R (Willams Percentage Range): The indicator has been in oversold territory, suggesting a potential reversal or consolidation.
Volatility Indicators:
- Bollinger Bands (BB): The bands have been narrowing, indicating decreasing volatility and a possible period of consolidation.
- Bollinger Band Percentage (BBP): The BBP has been fluctuating within a tight range, further supporting the consolidation view.
Volume Indicators:
- On-Balance Volume (OBV): The OBV has been negative, indicating distribution and potential selling pressure.
- Chaikin Money Flow (CMF): The CMF has been consistently negative, reflecting a bearish sentiment in terms of money flow.
Key Observations and Opinions:
- Trend: The trend indicators suggest a bearish bias in the short term.
- Momentum: Momentum indicators point towards a lack of strong buying interest and potential weakness in the stock.
- Volatility: Volatility indicators indicate a period of consolidation and reduced price fluctuations.
- Volume: Volume indicators show a negative OBV and CMF, signaling potential selling pressure.
Conclusion:
Based on the analysis of the technical indicators, the overall outlook for the next few days is bearish with a potential for further downside movement. The stock is likely to experience continued pressure and may consolidate within a narrow range. It is advisable to exercise caution and consider risk management strategies in trading or investing in this stock.