Technical Analysis of BSEP 2024-05-31
Overview:
In analyzing the technical indicators for BSEP stock over the last 5 days, we will delve into the trend, momentum, volatility, and volume indicators to provide a comprehensive outlook on the possible stock price movement in the coming days. By examining these key indicators, we aim to offer valuable insights and predictions for potential investors.
Trend Analysis:
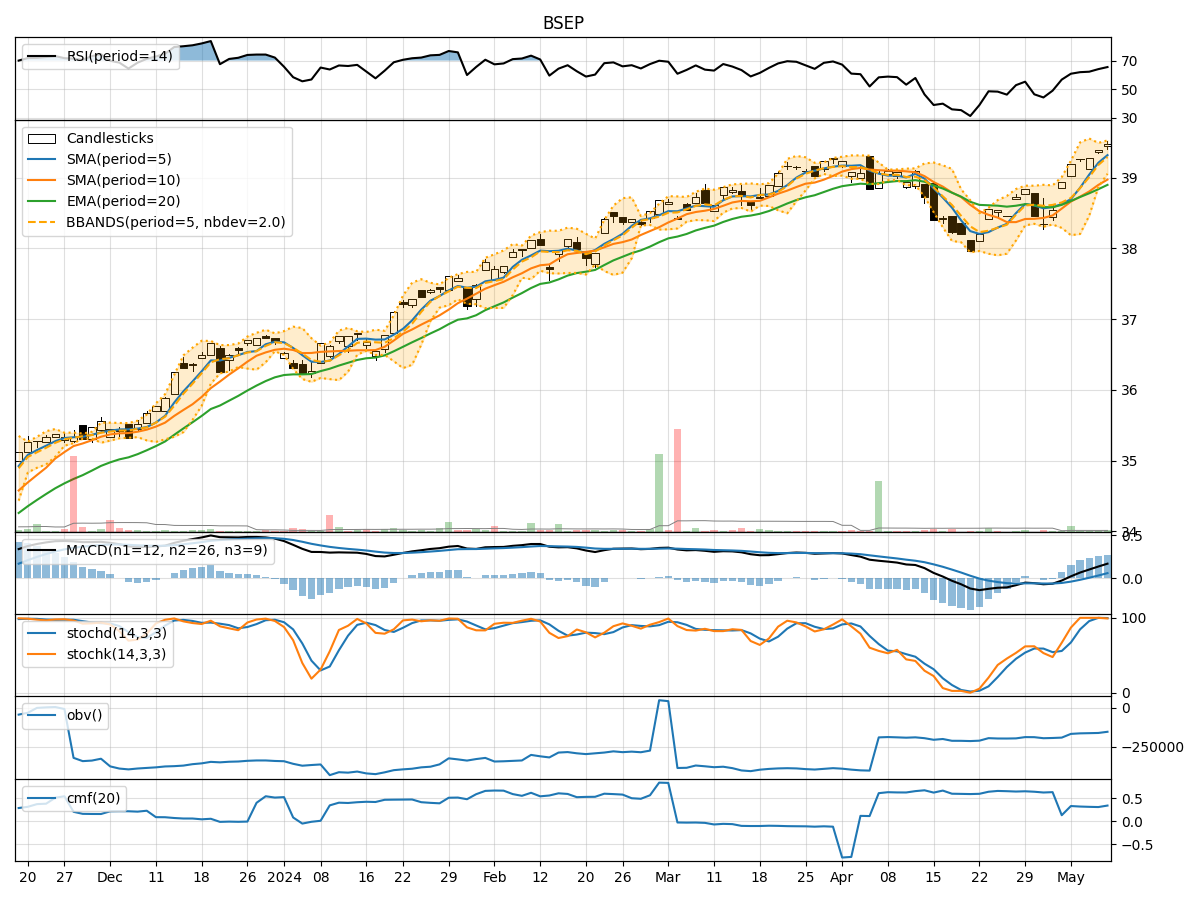
- Moving Averages (MA): The 5-day Moving Average (MA) has been relatively stable around the current stock price, indicating a short-term trend.
- MACD: The Moving Average Convergence Divergence (MACD) shows a positive trend with the MACD line consistently above the signal line.
- EMA: The Exponential Moving Average (EMA) has been gradually increasing, reflecting a bullish sentiment in the stock.
Key Observation: The trend indicators suggest a bullish outlook for BSEP stock in the short term.
Momentum Analysis:
- RSI: The Relative Strength Index (RSI) has been fluctuating but remains in the neutral zone, indicating balanced momentum.
- Stochastic Oscillator: Both %K and %D values have been declining, signaling a potential reversal in momentum.
- Williams %R: The Williams %R is in the oversold territory, suggesting a possible buying opportunity.
Key Observation: The momentum indicators point towards a neutral to slightly bearish momentum for BSEP stock.
Volatility Analysis:
- Bollinger Bands: The Bollinger Bands width has been narrowing, indicating decreasing volatility.
- Bollinger %B: The %B value has been fluctuating within a narrow range, suggesting stable price movement.
Key Observation: The volatility indicators imply a low volatility environment for BSEP stock.
Volume Analysis:
- On-Balance Volume (OBV): The OBV has been fluctuating, indicating mixed buying and selling pressure.
- Chaikin Money Flow (CMF): The CMF has been negative, suggesting a bearish money flow trend.
Key Observation: The volume indicators reflect mixed sentiment in terms of buying and selling pressure.
Conclusion:
Based on the analysis of trend, momentum, volatility, and volume indicators, the overall outlook for BSEP stock in the next few days is neutral to slightly bearish. While the trend indicators suggest a bullish sentiment, the momentum and volume indicators point towards a more cautious approach. The low volatility environment indicates a potential consolidation phase in the stock price.
Key Conclusion: The stock is likely to experience sideways movement with a slight bearish bias in the upcoming days. Investors should closely monitor key support and resistance levels for potential trading opportunities.