Technical Analysis of BTEC 2024-05-31
Overview:
In analyzing the technical indicators for BTEC over the last 5 days, we will delve into the trends, momentum, volatility, and volume aspects to provide a comprehensive outlook on the possible stock price movement. By examining key indicators such as moving averages, MACD, RSI, Bollinger Bands, and OBV, we aim to offer valuable insights and predictions for the upcoming days.
Trend Analysis:
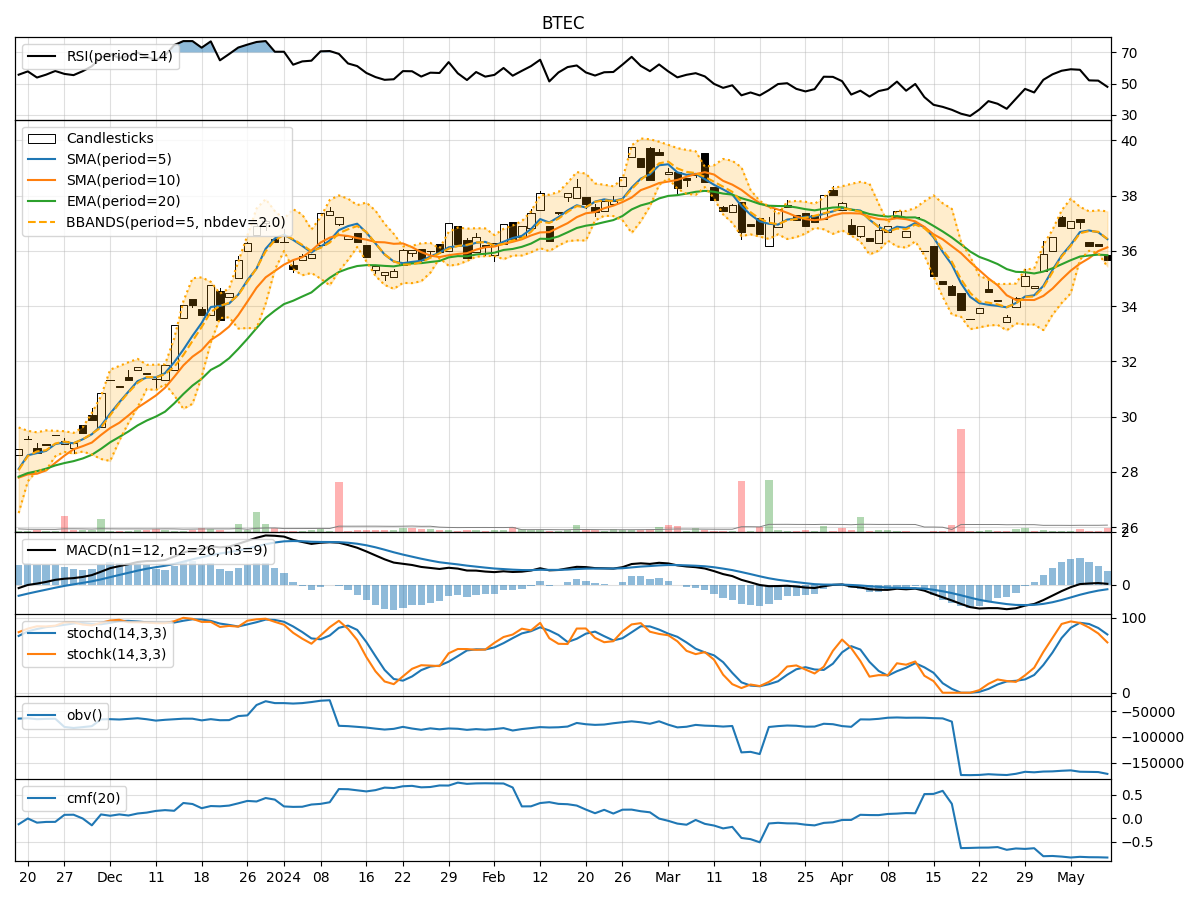
- Moving Averages (MA): The 5-day MA has been consistently below the closing prices, indicating a short-term downtrend.
- MACD: The MACD line has been below the signal line, suggesting a bearish momentum.
- EMA: The EMA has been declining, reflecting a weakening trend.
Momentum Analysis:
- RSI: The RSI has been fluctuating around the 50 level, indicating a lack of strong momentum.
- Stochastic Oscillator: Both %K and %D have been relatively low, signaling potential oversold conditions.
- Williams %R: The indicator has been in the oversold territory, suggesting a bearish sentiment.
Volatility Analysis:
- Bollinger Bands: The price has been trading within the bands, showing a period of consolidation.
- Bollinger %B: The %B indicator has been fluctuating around the midline, indicating a lack of clear direction.
Volume Analysis:
- On-Balance Volume (OBV): The OBV has been consistently negative, suggesting distribution by investors.
- Chaikin Money Flow (CMF): The CMF has been negative, indicating outflow of money from the stock.
Key Observations:
- The stock is currently in a short-term downtrend based on moving averages and MACD.
- Momentum indicators suggest a lack of strong buying interest.
- Volatility is relatively low, indicating a period of consolidation.
- Volume indicators show a consistent selling pressure in the stock.
Conclusion:
Based on the analysis of technical indicators, the outlook for BTEC in the next few days is bearish. The stock is likely to continue its downward trend with potential for further downside movement. Traders and investors should exercise caution and consider shorting or staying on the sidelines until a clearer bullish signal emerges. It is advisable to closely monitor key support levels and wait for a reversal confirmation before considering long positions.