Technical Analysis of BUL 2024-05-31
Overview:
In analyzing the technical indicators for BUL stock over the last 5 days, we will delve into the trends, momentum, volatility, and volume indicators to provide a comprehensive outlook on the possible stock price movement in the coming days. By examining these key aspects, we aim to offer valuable insights and predictions for potential investors.
Trend Indicators:
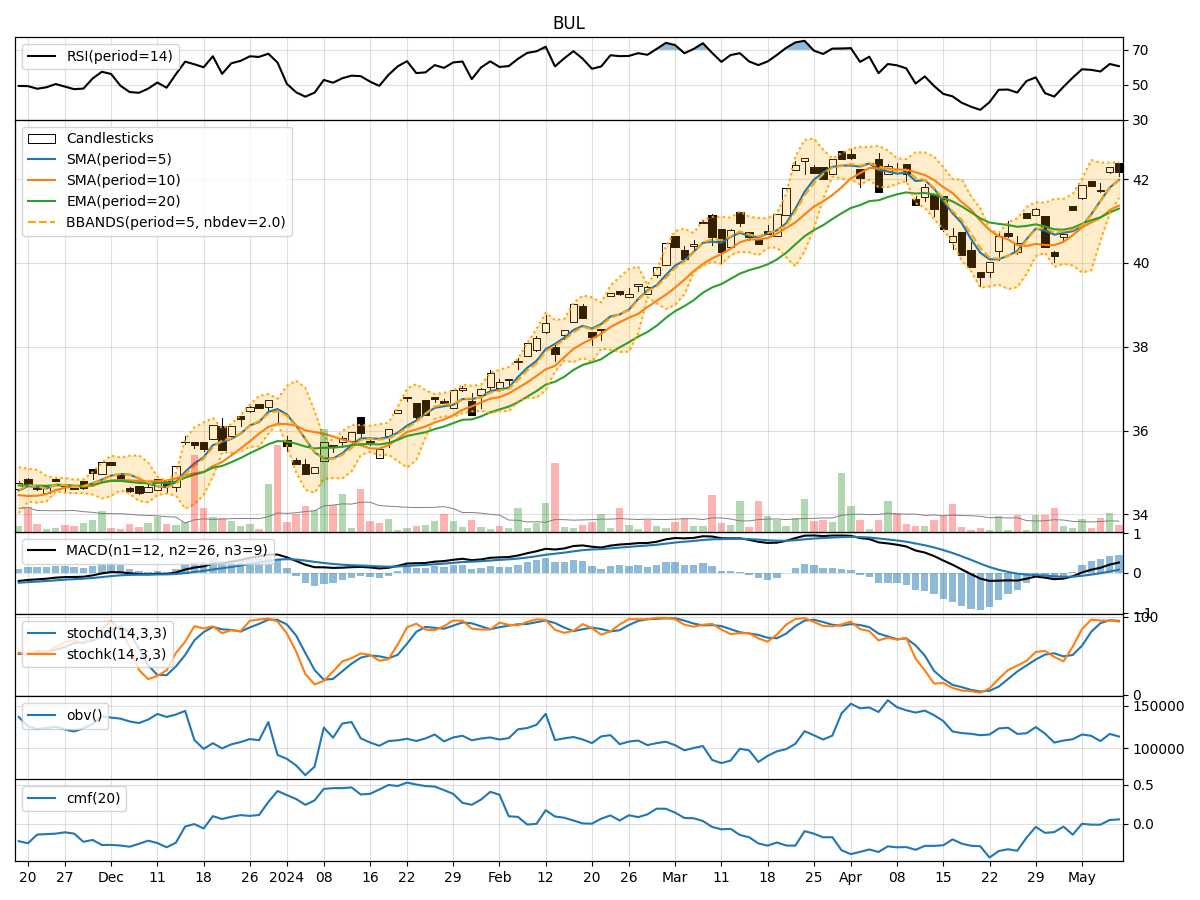
- Moving Averages (MA): The 5-day moving average has been relatively stable around the current stock price, indicating a neutral trend.
- MACD: The MACD line has been consistently positive, suggesting a bullish momentum in the short term.
- MACD Histogram: The MACD histogram has shown slight fluctuations but remains above the zero line, indicating bullish momentum.
Momentum Indicators:
- RSI: The RSI has been fluctuating around the 50 level, indicating a neutral momentum.
- Stochastic Oscillator: Both %K and %D have been hovering around the mid-level, suggesting a lack of strong directional momentum.
- Williams %R: The Williams %R has shown oversold conditions in the past but has not provided a clear signal recently.
Volatility Indicators:
- Bollinger Bands: The Bollinger Bands have shown narrowing volatility, with the stock price trading within the bands consistently.
- Bollinger %B: The %B indicator has remained relatively stable around the mid-level, indicating a balanced volatility environment.
Volume Indicators:
- On-Balance Volume (OBV): The OBV has shown mixed signals, with alternating positive and negative values, reflecting indecision in the market.
- Chaikin Money Flow (CMF): The CMF has been close to zero, indicating a lack of strong buying or selling pressure.
Key Observations:
- The trend indicators suggest a neutral to slightly bullish outlook in the short term.
- Momentum indicators indicate a lack of strong directional momentum, reflecting a consolidation phase.
- Volatility indicators point towards a stable and balanced volatility environment.
- Volume indicators show mixed signals, indicating uncertainty among market participants.
Conclusion:
Based on the analysis of the technical indicators, the next few days for BUL stock are likely to see sideways movement with limited volatility. The lack of strong momentum and mixed signals from volume indicators suggest a period of consolidation. Investors should exercise caution and wait for clearer signals before making significant trading decisions.