Technical Analysis of BUYZ 2024-05-31
Overview:
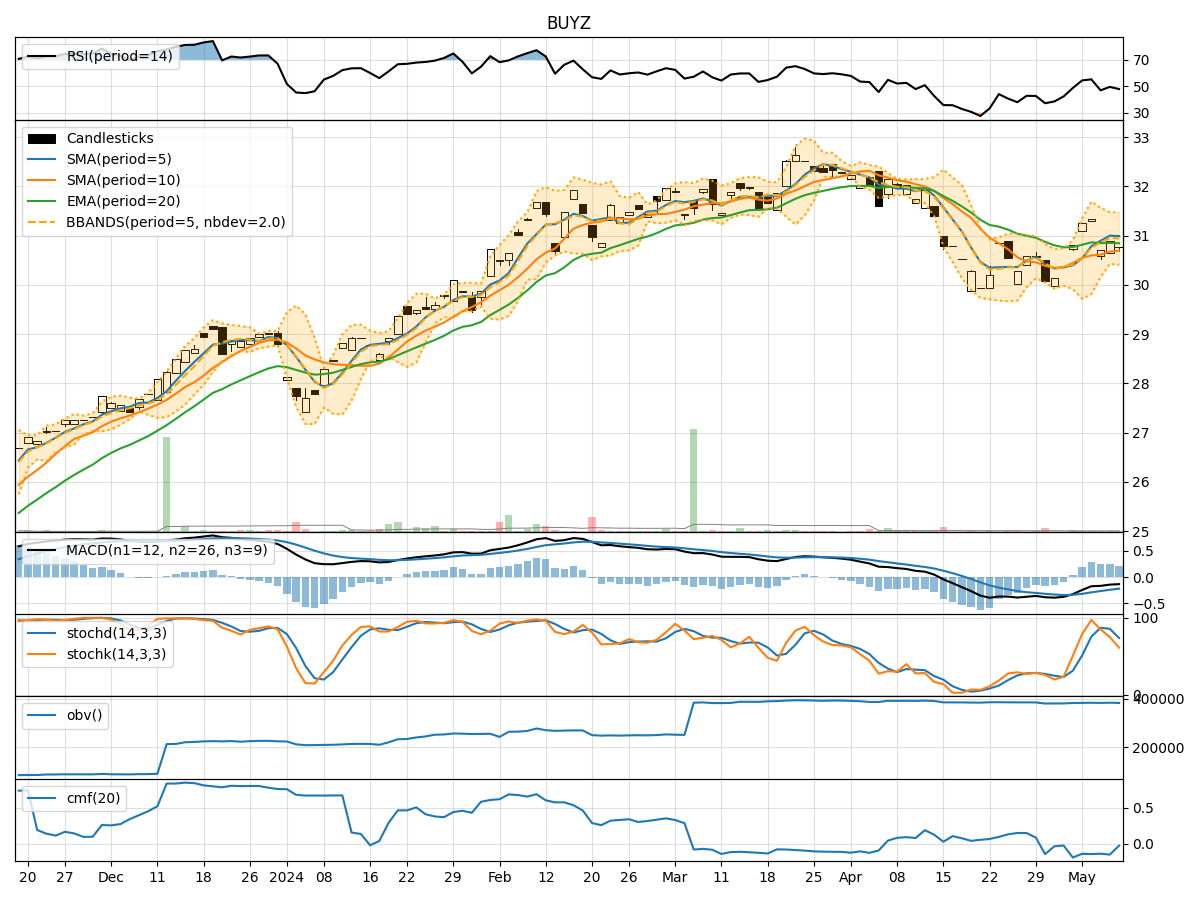
In analyzing the technical indicators for BUYZ over the last 5 days, we will delve into the trend, momentum, volatility, and volume indicators to provide a comprehensive outlook on the possible stock price movement in the coming days.
Trend Analysis:
- Moving Averages (MA): The 5-day MA has been consistently below the closing price, indicating a short-term downtrend.
- MACD: The MACD line has been negative, with the MACD histogram showing a decreasing trend, signaling a potential bearish momentum.
Momentum Analysis:
- RSI: The RSI has been declining and is currently below 50, suggesting weakening momentum.
- Stochastic Oscillator: Both %K and %D have been decreasing, indicating a bearish momentum.
Volatility Analysis:
- Bollinger Bands (BB): The stock price has been trading within the lower Bollinger Band, indicating a potential oversold condition.
Volume Analysis:
- On-Balance Volume (OBV): The OBV has been relatively stable, showing no significant divergence.
- Chaikin Money Flow (CMF): The CMF has been positive, indicating buying pressure in the stock.
Key Observations:
- The stock is currently in a short-term downtrend based on moving averages and MACD.
- Momentum indicators like RSI and Stochastic Oscillator suggest a bearish sentiment.
- Volatility is relatively low, with the stock trading near the lower Bollinger Band.
- Volume indicators show no significant divergence, indicating stability in trading volume.
Conclusion:
Based on the analysis of technical indicators, the outlook for BUYZ in the next few days is bearish. The stock is likely to continue its downward trend, supported by the negative momentum signals and lack of significant buying pressure. Traders and investors should exercise caution and consider shorting or staying on the sidelines until a clear reversal pattern emerges.