Technical Analysis of BWET 2024-05-31
Overview:
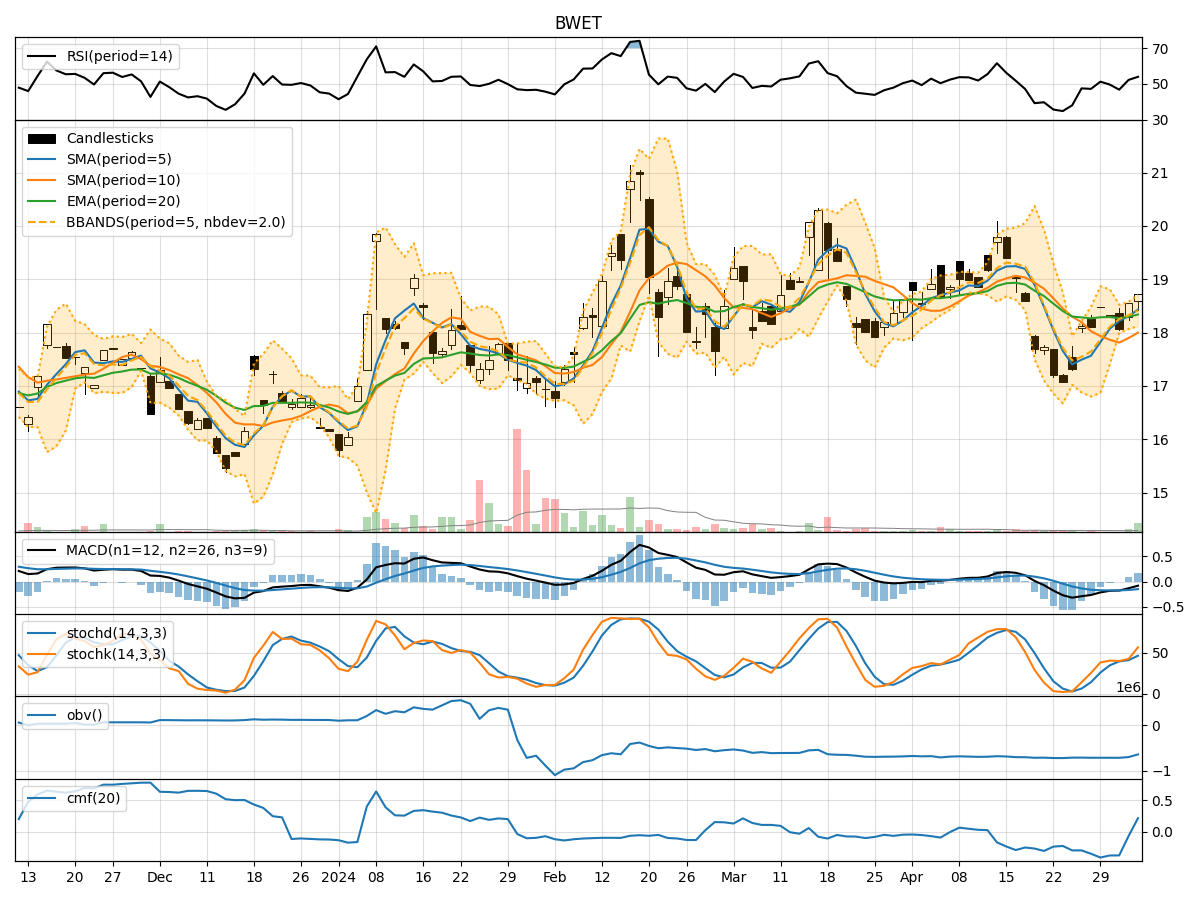
In the last 5 trading days, BWET stock has shown a downward trend in both price and volume. The moving averages have been declining, and the MACD indicator has been negative, indicating bearish momentum. Additionally, the RSI and stochastic indicators have been decreasing, showing weakening momentum. The Bollinger Bands have been narrowing, suggesting decreasing volatility. On the volume side, the OBV indicator has been negative, indicating selling pressure.
Trend Analysis:
- Moving Averages (MA): The 5-day MA has been consistently below the longer-term SMAs and EMAs, indicating a downward trend in the short term.
- MACD: The MACD line has been below the signal line, and both have been in negative territory, signaling a bearish trend.
Momentum Analysis:
- RSI: The RSI has been declining, indicating weakening momentum.
- Stochastic Oscillator: Both %K and %D have been decreasing, suggesting a loss in buying pressure.
Volatility Analysis:
- Bollinger Bands (BB): The bands have been narrowing, indicating decreasing volatility in the stock price.
Volume Analysis:
- On-Balance Volume (OBV): The OBV has been negative, suggesting more selling volume than buying volume.
Key Observations:
- The stock is in a downtrend based on moving averages and MACD.
- Momentum indicators like RSI and Stochastic Oscillator show weakening momentum.
- Volatility is decreasing as per the Bollinger Bands.
- Volume indicators like OBV indicate selling pressure.
Conclusion:
Based on the technical analysis of the trend, momentum, volatility, and volume indicators, the next few days' possible stock price movement for BWET is likely to continue downwards. The overall picture painted by the indicators suggests a bearish sentiment in the market for BWET. Traders and investors should exercise caution and consider waiting for more positive signals before considering any long positions.