Technical Analysis of CBON 2024-05-31
Overview:
In analyzing the technical indicators for CBON stock over the last 5 days, we will delve into the trends, momentum, volatility, and volume indicators to provide a comprehensive outlook on the possible stock price movement in the coming days.
Trend Analysis:
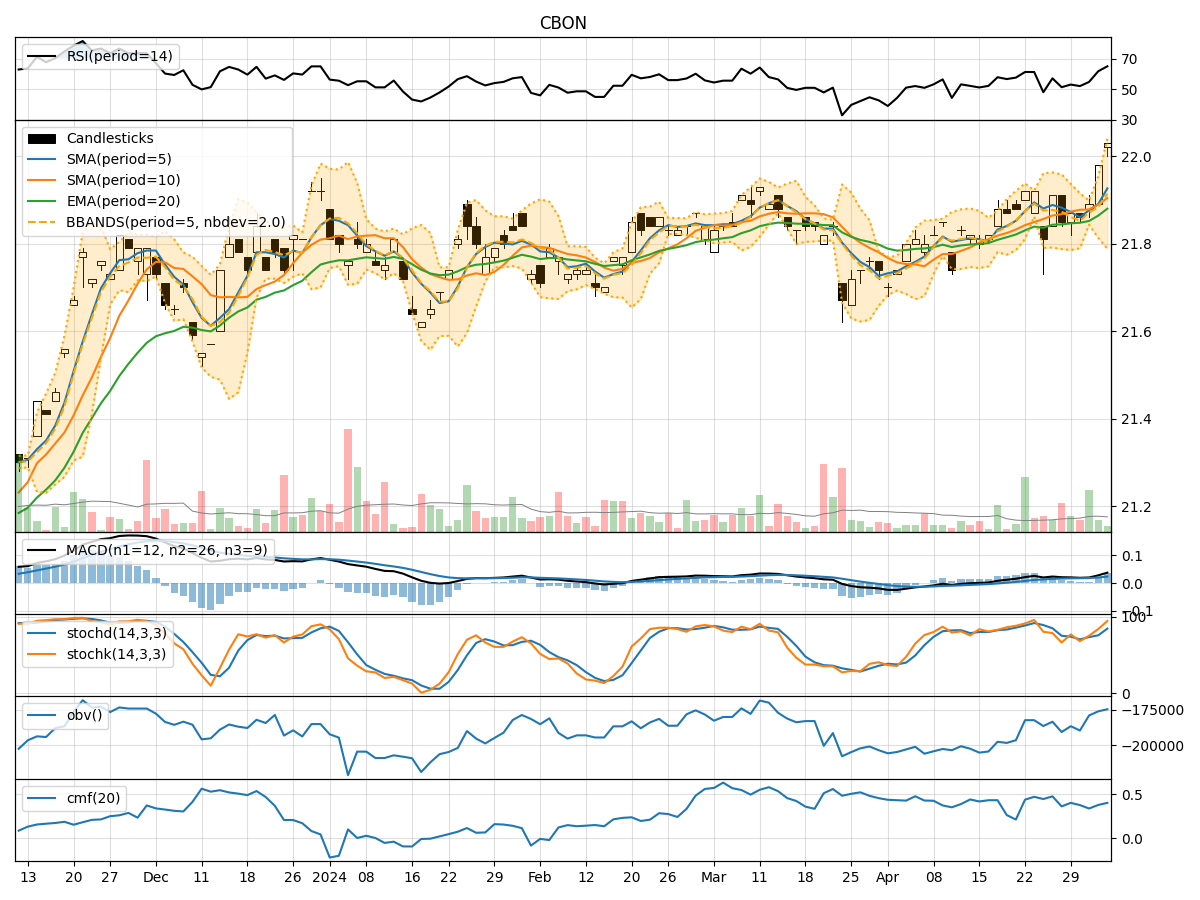
- Moving Averages (MA): The 5-day Moving Average (MA) has been fluctuating around the closing prices, indicating short-term price trends. The Simple Moving Average (SMA) and Exponential Moving Average (EMA) show a slight downward trend.
- MACD: The Moving Average Convergence Divergence (MACD) has been negative, suggesting a bearish momentum in the stock price.
Momentum Analysis:
- RSI: The Relative Strength Index (RSI) has been fluctuating around the 50 level, indicating a lack of strong momentum in either direction.
- Stochastic Oscillator: The Stochastic indicators show mixed signals, with the %K and %D lines not providing a clear trend direction.
Volatility Analysis:
- Bollinger Bands (BB): The Bollinger Bands have widened, indicating increased volatility in the stock price.
Volume Analysis:
- On-Balance Volume (OBV): The OBV has been fluctuating, suggesting indecision among investors regarding the stock.
- Chaikin Money Flow (CMF): The CMF has been positive but not significantly strong, indicating a neutral sentiment.
Key Observations:
- The stock is currently experiencing a lack of strong trend direction, as indicated by the moving averages and momentum oscillators.
- Volatility has increased, which could lead to larger price swings in the coming days.
- The volume indicators suggest a mixed sentiment among investors, with no clear accumulation or distribution pattern.
Conclusion:
Based on the analysis of the technical indicators, the stock is likely to continue trading sideways in the near term. The lack of a clear trend direction, mixed momentum signals, and fluctuating volume indicate a period of consolidation. Traders may expect the stock price to remain range-bound without a significant breakout in either direction. It is advisable to closely monitor the indicators for any signs of a potential trend reversal before making any trading decisions.