Technical Analysis of DAUG 2024-05-31
Overview:
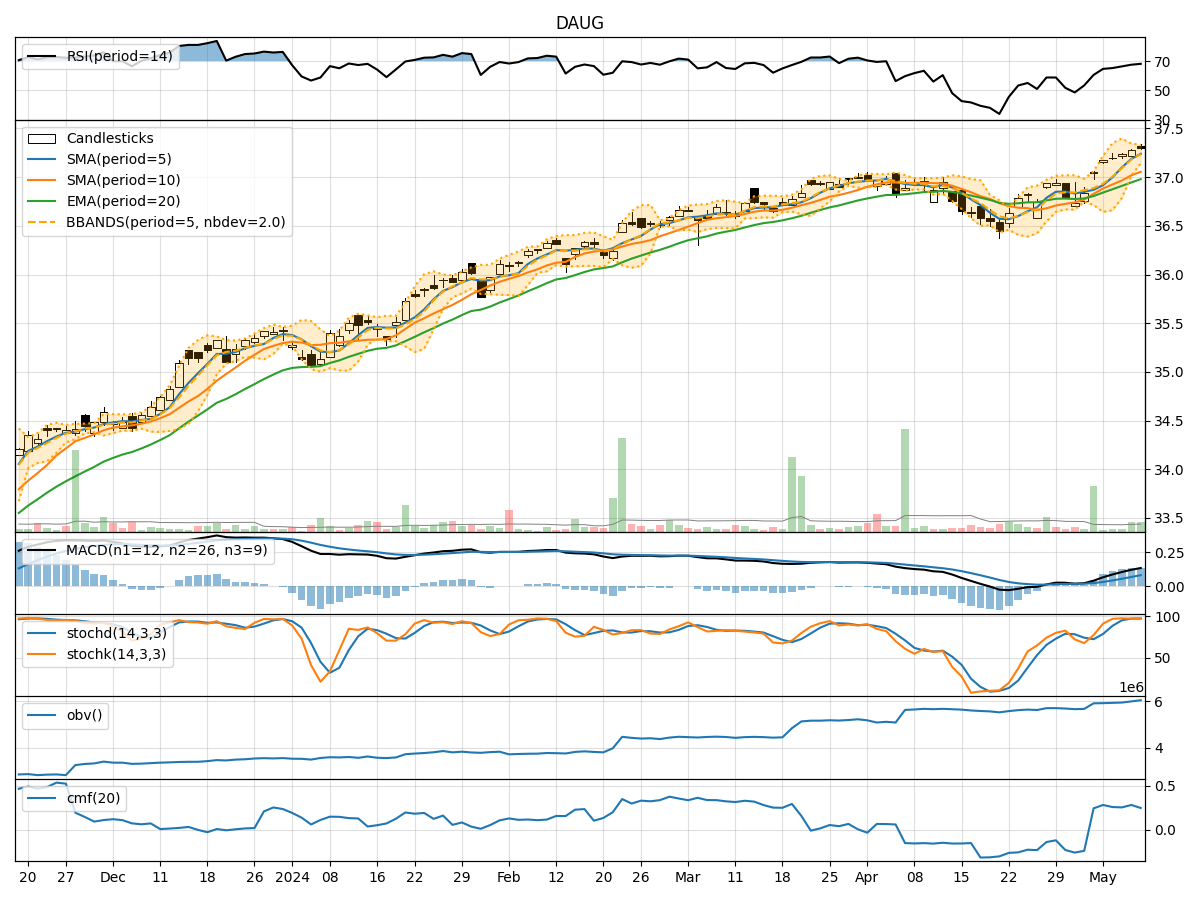
In analyzing the technical indicators for DAUG stock over the last 5 days, we will delve into the trend, momentum, volatility, and volume indicators to provide a comprehensive outlook on the possible stock price movement in the coming days. By examining these key indicators, we aim to offer valuable insights and predictions for potential investors.
Trend Analysis:
- Moving Averages (MA): The 5-day moving average has been relatively stable around the current stock price, indicating a short-term equilibrium.
- MACD: The MACD line has been positive, suggesting a bullish momentum in the stock.
- EMA: The exponential moving average has been trending upwards, reflecting a positive sentiment in the market.
Momentum Analysis:
- RSI: The Relative Strength Index has been fluctuating around the overbought territory, indicating a strong bullish momentum.
- Stochastic Oscillator: Both %K and %D have been declining, signaling a potential reversal in the stock's price direction.
- Williams %R: The Williams %R has been moving towards oversold levels, suggesting a possible upcoming buying opportunity.
Volatility Analysis:
- Bollinger Bands: The stock price has been trading within the Bollinger Bands, indicating a period of consolidation.
- Bollinger %B: The %B indicator has been fluctuating within a narrow range, suggesting a lack of significant volatility.
Volume Analysis:
- On-Balance Volume (OBV): The OBV indicator has been relatively stable, indicating a balance between buying and selling pressure.
- Chaikin Money Flow (CMF): The CMF has been gradually increasing, reflecting a positive inflow of money into the stock.
Conclusion:
Based on the analysis of the technical indicators, the stock is currently exhibiting a bullish sentiment in terms of trend and momentum. However, the declining stochastic oscillator and the Williams %R moving towards oversold levels suggest a potential short-term pullback or consolidation in the stock price. The stable OBV and increasing CMF indicate underlying strength in the stock.
Therefore, the next few days may see a temporary correction or sideways movement before potentially resuming the bullish trend. Investors should closely monitor the stochastic oscillator and Williams %R for potential entry points, while considering the overall positive trend and momentum in their decision-making process.