Technical Analysis of DEM 2024-05-31
Overview:
In analyzing the technical indicators for DEM stock over the last 5 days, we will delve into the trends, momentum, volatility, and volume indicators to provide a comprehensive outlook on the possible stock price movement in the coming days. By examining these key indicators, we aim to offer valuable insights and predictions for informed decision-making.
Trend Indicators:
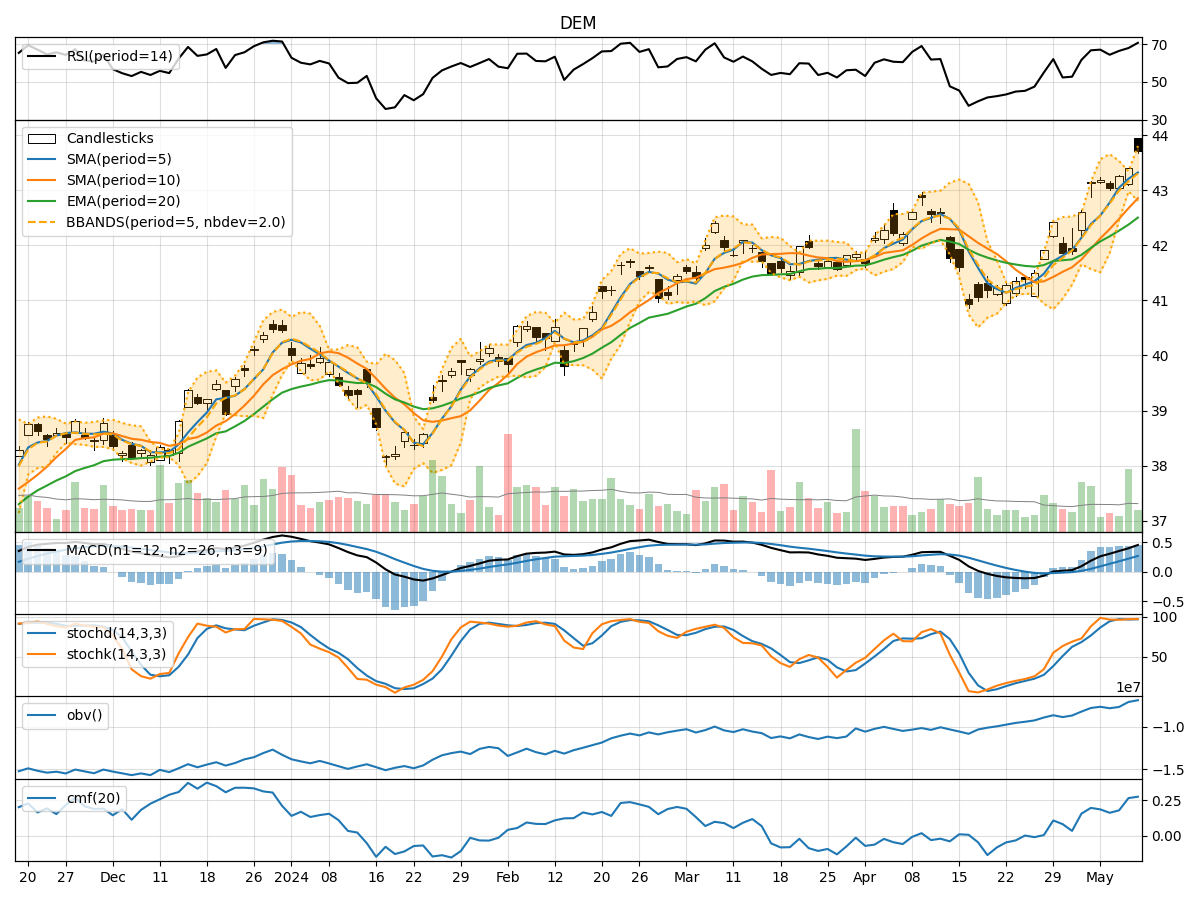
- Moving Averages (MA): The 5-day MA has been fluctuating around the closing prices, indicating short-term price trends. The SMA(10) and EMA(20) have shown slight variations but have generally been close to the closing prices.
- MACD and Signal Line: The MACD has been positive, indicating a bullish trend, although the MACD Histogram has been decreasing, suggesting a potential weakening of the bullish momentum.
Momentum Indicators:
- RSI: The RSI has been fluctuating but has generally been in the neutral zone, indicating a balanced momentum between buying and selling pressure.
- Stochastic Oscillator: Both %K and %D have been declining, indicating a potential bearish momentum.
- Williams %R: The indicator has been in the oversold territory, suggesting a possible reversal or continuation of the downtrend.
Volatility Indicators:
- Bollinger Bands: The bands have been narrowing, indicating decreasing volatility. The price has been trading within the bands, suggesting a period of consolidation.
- Bollinger %B: The %B has been fluctuating around 0.5, indicating the price is at the middle band, reflecting a neutral stance.
Volume Indicators:
- On-Balance Volume (OBV): The OBV has been fluctuating, indicating mixed buying and selling pressure.
- Chaikin Money Flow (CMF): The CMF has been positive, suggesting a potential inflow of money into the stock.
Key Observations and Opinions:
- Trend: The trend indicators show a mixed picture with a potential weakening of the bullish momentum based on the MACD Histogram.
- Momentum: The momentum indicators suggest a bearish bias with the Stochastic Oscillator in oversold territory.
- Volatility: Volatility has been decreasing, indicating a period of consolidation and potential price stability.
- Volume: The volume indicators show mixed signals with fluctuating OBV and positive CMF, indicating some buying interest.
Conclusion:
Based on the analysis of the technical indicators, the next few days' possible stock price movement for DEM is likely to be sideways with a slight bearish bias. Traders should exercise caution and closely monitor key support and resistance levels for potential entry or exit points. It is advisable to wait for further confirmation from the indicators before making significant trading decisions.