Technical Analysis of DFSB 2024-05-31
Overview:
In analyzing the technical indicators for DFSB stock over the last 5 days, we will delve into the trend, momentum, volatility, and volume indicators to provide a comprehensive outlook on the possible future stock price movement. By examining these key indicators, we aim to offer valuable insights and predictions for the upcoming trading days.
Trend Analysis:
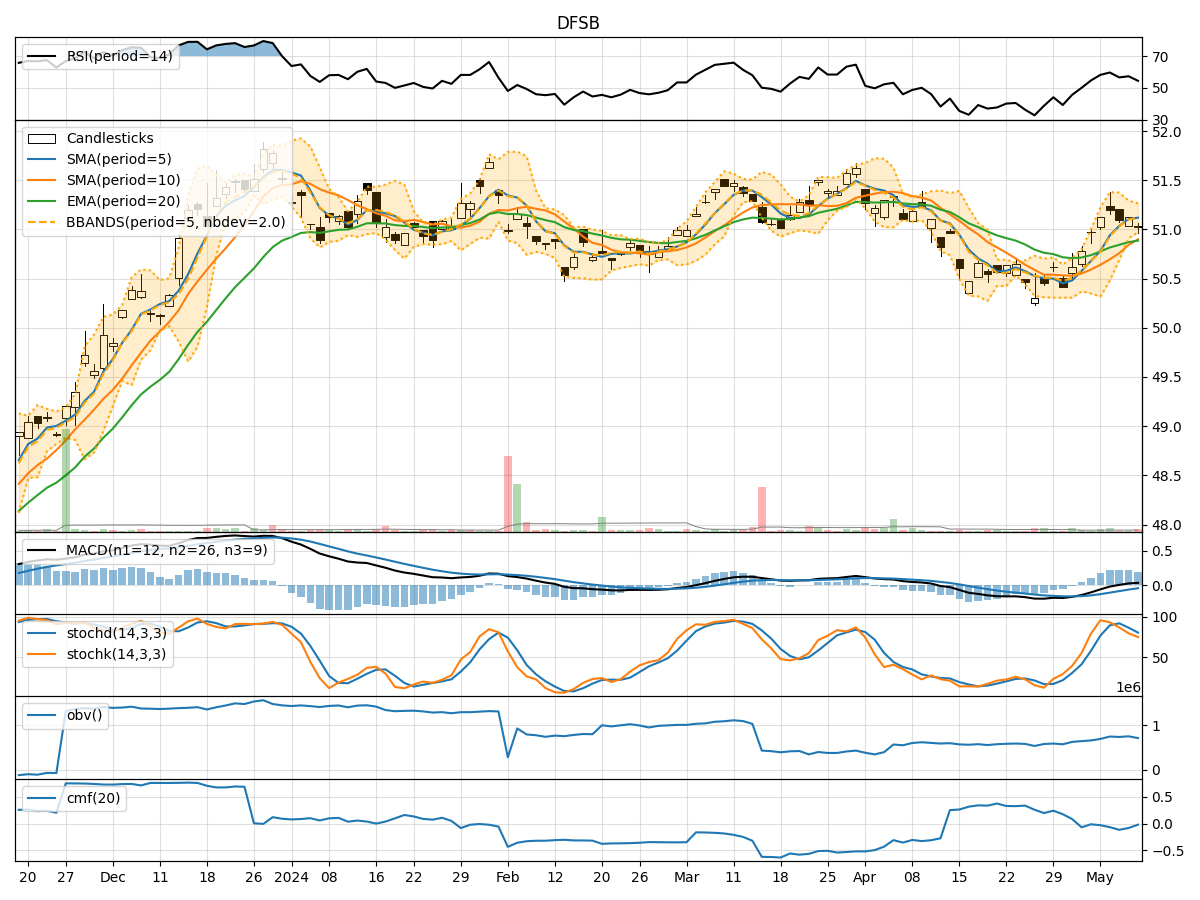
- Moving Averages (MA): The 5-day Moving Average (MA) has been gradually decreasing from 51.012 to 50.790, indicating a short-term downtrend in the stock price.
- MACD: The MACD line has shown a slight increase over the last few days, but the MACD Histogram has been decreasing, suggesting a potential reversal or consolidation in the near future.
Momentum Analysis:
- RSI: The Relative Strength Index (RSI) has been fluctuating around the mid-level, indicating a lack of strong momentum in either direction.
- Stochastic Oscillator: Both %K and %D of the Stochastic Oscillator have been relatively low, signaling a potential oversold condition in the stock.
Volatility Analysis:
- Bollinger Bands (BB): The Bollinger Bands have been narrowing, indicating decreasing volatility in the stock price.
- Bollinger %B: The %B indicator has been hovering around the lower band, suggesting a possible oversold condition.
Volume Analysis:
- On-Balance Volume (OBV): The OBV has shown a mixed trend, with some days experiencing selling pressure and others showing accumulation.
- Chaikin Money Flow (CMF): The CMF has been positive over the last few days, indicating buying pressure in the stock.
Key Observations:
- The stock is currently in a short-term downtrend based on the moving averages.
- Momentum indicators suggest a lack of strong directional momentum.
- Volatility is decreasing, potentially leading to a period of consolidation.
- Volume indicators show mixed signals, with some accumulation and distribution phases.
Conclusion:
Based on the analysis of the technical indicators, the stock price of DFSB is likely to experience further downside movement in the near term. The trend is bearish, momentum is weak, and volatility is decreasing, pointing towards a possible consolidation phase or continued downward movement. Traders and investors should exercise caution and consider waiting for more definitive signals before making any significant trading decisions.