Technical Analysis of DFSI 2024-05-31
Overview:
In analyzing the technical indicators for DFSI over the last 5 days, we will delve into the trend, momentum, volatility, and volume indicators to provide a comprehensive outlook on the possible stock price movement in the coming days. By examining these key indicators, we aim to offer valuable insights and predictions for informed decision-making.
Trend Analysis:
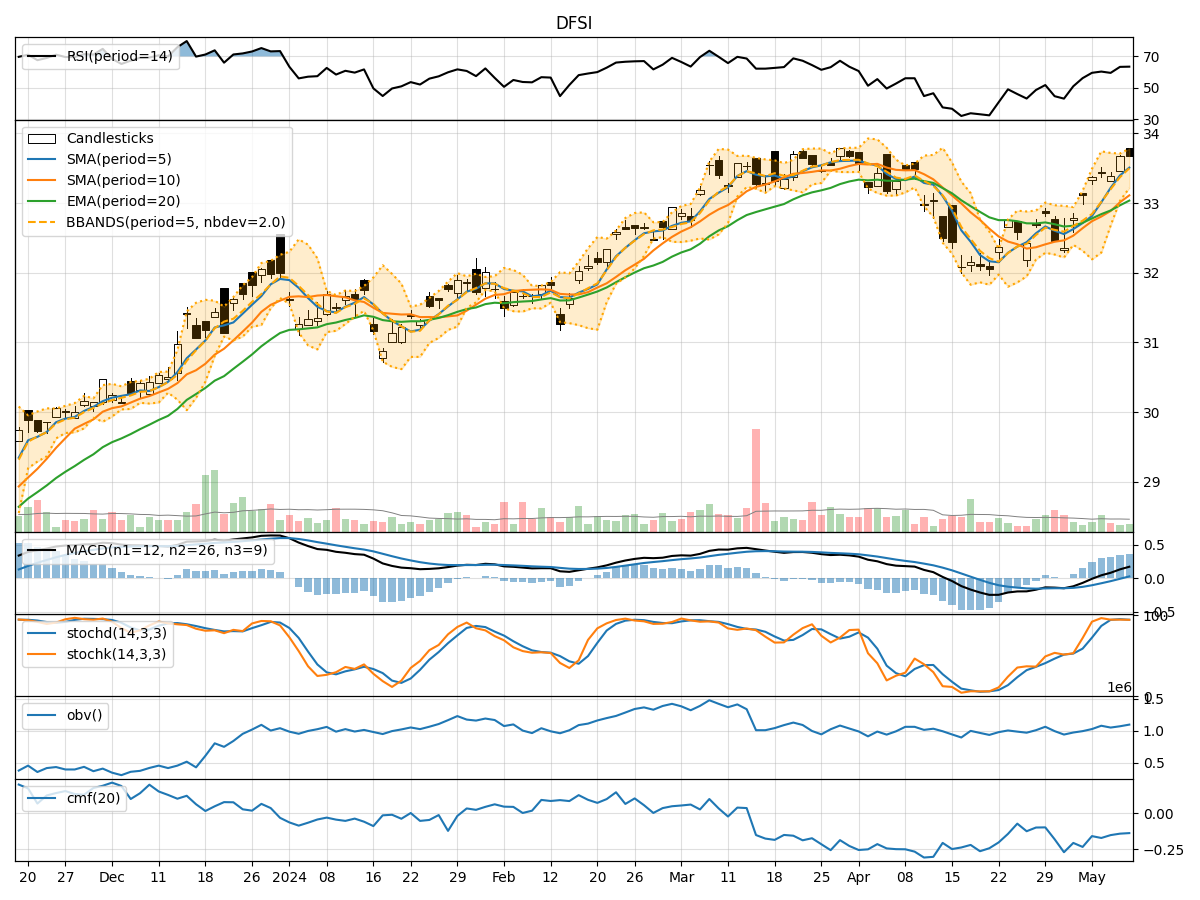
- Moving Averages (MA): The 5-day Moving Average (MA) has been fluctuating around the closing prices, indicating short-term price trends. The Simple Moving Average (SMA) and Exponential Moving Average (EMA) show a slight downward trend, suggesting a potential bearish sentiment.
- MACD: The Moving Average Convergence Divergence (MACD) and its signal line (MACDH) have been hovering around the zero line, indicating a lack of strong trend direction.
Momentum Analysis:
- RSI: The Relative Strength Index (RSI) has been oscillating around the neutral 50 level, suggesting a balanced momentum between buying and selling pressure.
- Stochastic Oscillator: Both %K and %D of the Stochastic Oscillator are in the oversold region, indicating a potential reversal in price direction.
- Williams %R: The Williams %R is also in the oversold territory, signaling a possible buying opportunity.
Volatility Analysis:
- Bollinger Bands (BB): The Bollinger Bands are narrowing, indicating decreasing volatility in the stock price. This could precede a period of consolidation or a breakout.
- Bollinger Band %B: The %B indicator is below 0.5, suggesting the stock is trading below the lower Bollinger Band, potentially indicating an oversold condition.
Volume Analysis:
- On-Balance Volume (OBV): The OBV has been declining, indicating that selling volume has been outweighing buying volume over the past few days.
- Chaikin Money Flow (CMF): The CMF is negative, reflecting a lack of buying pressure in the market.
Conclusion:
Based on the analysis of the technical indicators, the stock of DFSI is currently exhibiting signs of bearish sentiment. The trend indicators suggest a potential downward movement, supported by the decreasing moving averages and lack of strong trend signals from the MACD. Momentum indicators point towards a possible reversal in price direction, with oversold conditions in the Stochastic Oscillator and Williams %R.
Moreover, the volatility indicators indicate a decrease in price fluctuations, which could lead to a period of consolidation or a breakout. The volume indicators further support the bearish outlook, with selling volume outweighing buying volume.
Therefore, the next few days for DFSI are likely to see a downward movement in stock price, with a potential for consolidation before any significant trend reversal. Traders and investors should exercise caution and consider risk management strategies in light of the current market dynamics.