Technical Analysis of DFUV 2024-05-31
Overview:
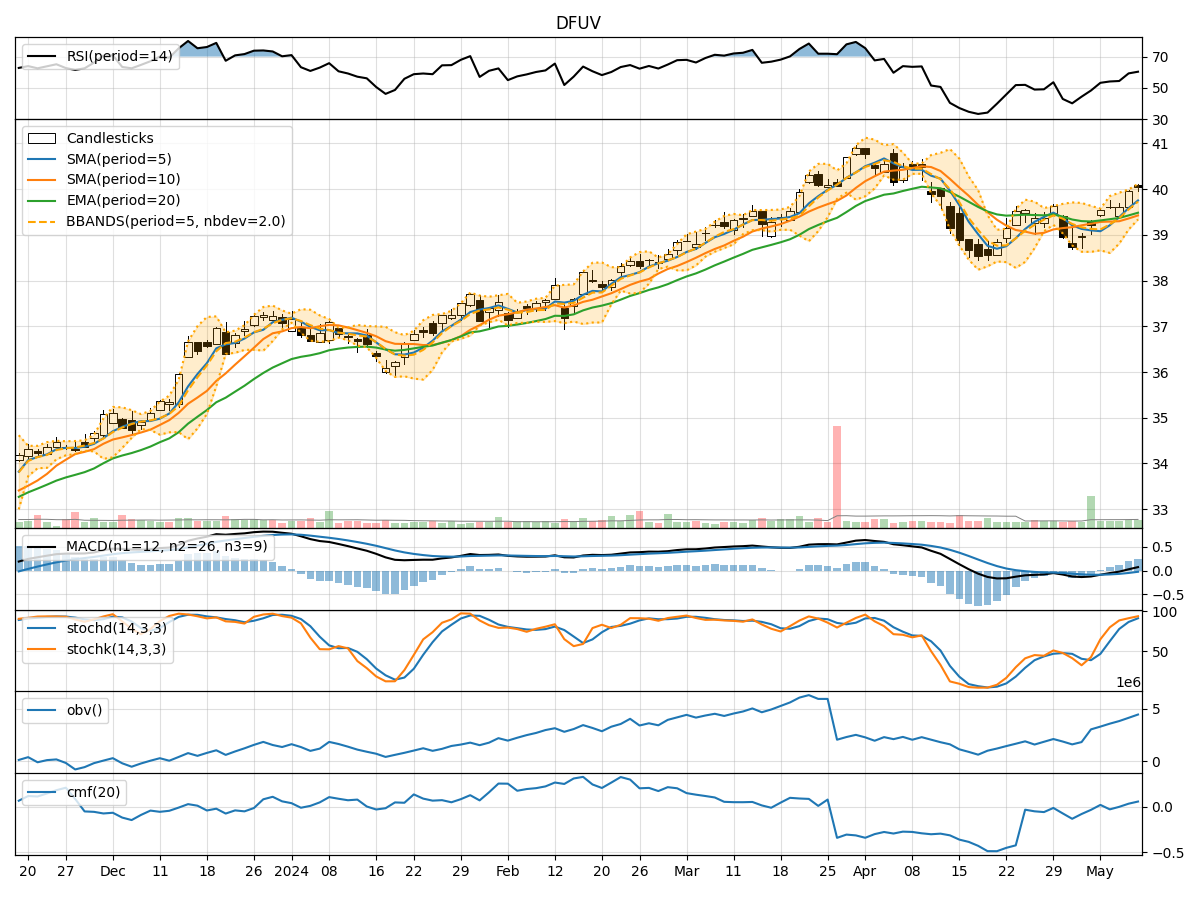
In analyzing the technical indicators for DFUV over the last 5 days, we will delve into the trend, momentum, volatility, and volume indicators to provide a comprehensive outlook on the possible stock price movement in the coming days.
Trend Analysis:
- Moving Averages (MA): The 5-day MA has been consistently below the closing prices, indicating a short-term downtrend.
- MACD: The MACD line has been hovering around the signal line, suggesting a lack of strong momentum in either direction.
- EMA: The EMA has been slightly declining, reflecting a bearish sentiment in the short to medium term.
Momentum Analysis:
- RSI: The RSI has been fluctuating around the 50 level, indicating indecision in the market.
- Stochastic Oscillator: Both %K and %D have been relatively low, signaling potential oversold conditions.
- Williams %R: The indicator has been in oversold territory, suggesting a possible reversal in the near future.
Volatility Analysis:
- Bollinger Bands (BB): The bands have been narrowing, indicating decreasing volatility and a potential breakout in the future.
- BB %B: The %B indicator has been fluctuating within a tight range, reflecting consolidation in the stock price.
Volume Analysis:
- On-Balance Volume (OBV): The OBV has shown mixed signals, with no clear trend in volume accumulation or distribution.
- Chaikin Money Flow (CMF): The CMF has been slightly positive, indicating some buying pressure in the market.
Key Observations:
- The stock is currently in a consolidation phase with no clear trend direction.
- Momentum indicators suggest a possible reversal or bounce from oversold levels.
- Volatility is decreasing, indicating a potential period of range-bound trading.
- Volume indicators show mixed signals, reflecting uncertainty among market participants.
Conclusion:
Based on the analysis of the technical indicators, the next few days for DFUV are likely to see sideways movement with a potential for a bullish reversal. Traders should watch for a breakout from the current consolidation range, with key levels to monitor for confirmation of a new trend direction. It is advisable to wait for more definitive signals before taking significant trading positions.