Technical Analysis of DGT 2024-05-31
Overview:
In analyzing the technical indicators for the stock of DGT over the last 5 days, we will delve into the trends, momentum, volatility, and volume indicators to provide a comprehensive outlook on the possible stock price movement in the coming days. By examining these key indicators, we aim to offer valuable insights and predictions for potential investors.
Trend Indicators:
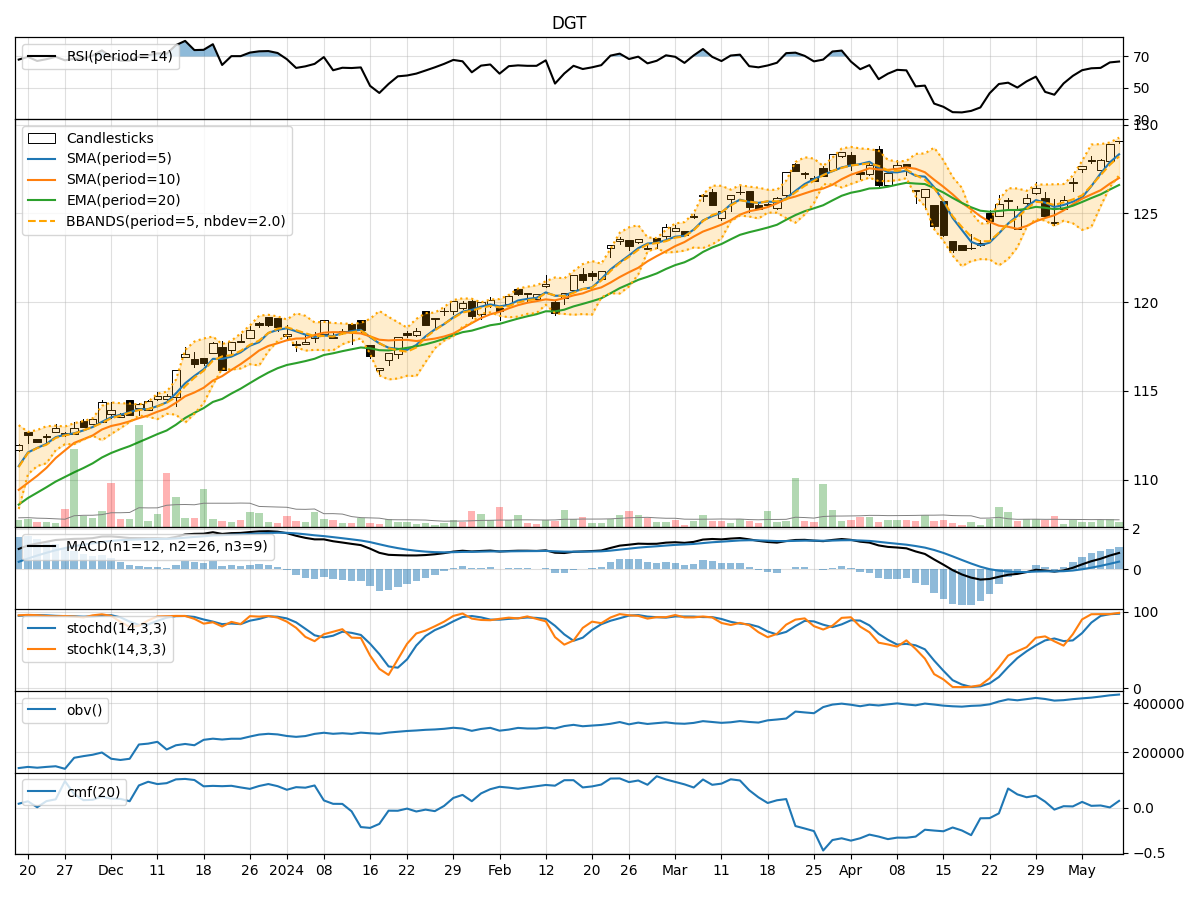
- Moving Averages (MA): The 5-day Moving Average (MA) has been fluctuating around the closing prices, indicating short-term price trends. The Simple Moving Average (SMA) and Exponential Moving Average (EMA) show a slight downward trend, suggesting a potential bearish sentiment.
- MACD: The Moving Average Convergence Divergence (MACD) and its signal line have been decreasing, indicating a weakening bullish momentum.
- Conclusion: The trend indicators suggest a bearish outlook for the stock in the short term.
Momentum Indicators:
- RSI: The Relative Strength Index (RSI) has been fluctuating but remains below the overbought threshold, indicating a neutral to slightly bearish momentum.
- Stochastic Oscillator: Both %K and %D of the Stochastic Oscillator are trending downwards, signaling a bearish momentum.
- Conclusion: The momentum indicators suggest a bearish sentiment for the stock in the near future.
Volatility Indicators:
- Bollinger Bands (BB): The Bollinger Bands show a narrowing range, indicating decreasing volatility in the stock price.
- Conclusion: The volatility indicators suggest a decreasing volatility in the stock, potentially leading to a period of consolidation.
Volume Indicators:
- On-Balance Volume (OBV): The OBV has been fluctuating but shows a slight increase, suggesting some buying pressure.
- Chaikin Money Flow (CMF): The CMF has been negative, indicating a bearish money flow.
- Conclusion: The volume indicators provide a mixed signal, with OBV showing some buying interest while CMF indicates a bearish sentiment.
Overall Conclusion:
Based on the analysis of the technical indicators, the stock of DGT is likely to experience a bearish trend in the coming days, supported by the trend and momentum indicators. The decreasing volatility may lead to a period of consolidation, while the volume indicators provide a mixed signal with some buying interest but overall bearish money flow. Investors should exercise caution and consider waiting for more clarity in the market dynamics before making any significant investment decisions.