Technical Analysis of DIHP 2024-05-31
Overview:
In analyzing the technical indicators for DIHP over the last 5 days, we will delve into the trend, momentum, volatility, and volume indicators to provide a comprehensive outlook on the possible stock price movement. By examining these key aspects, we aim to offer valuable insights and predictions for the upcoming days.
Trend Analysis:
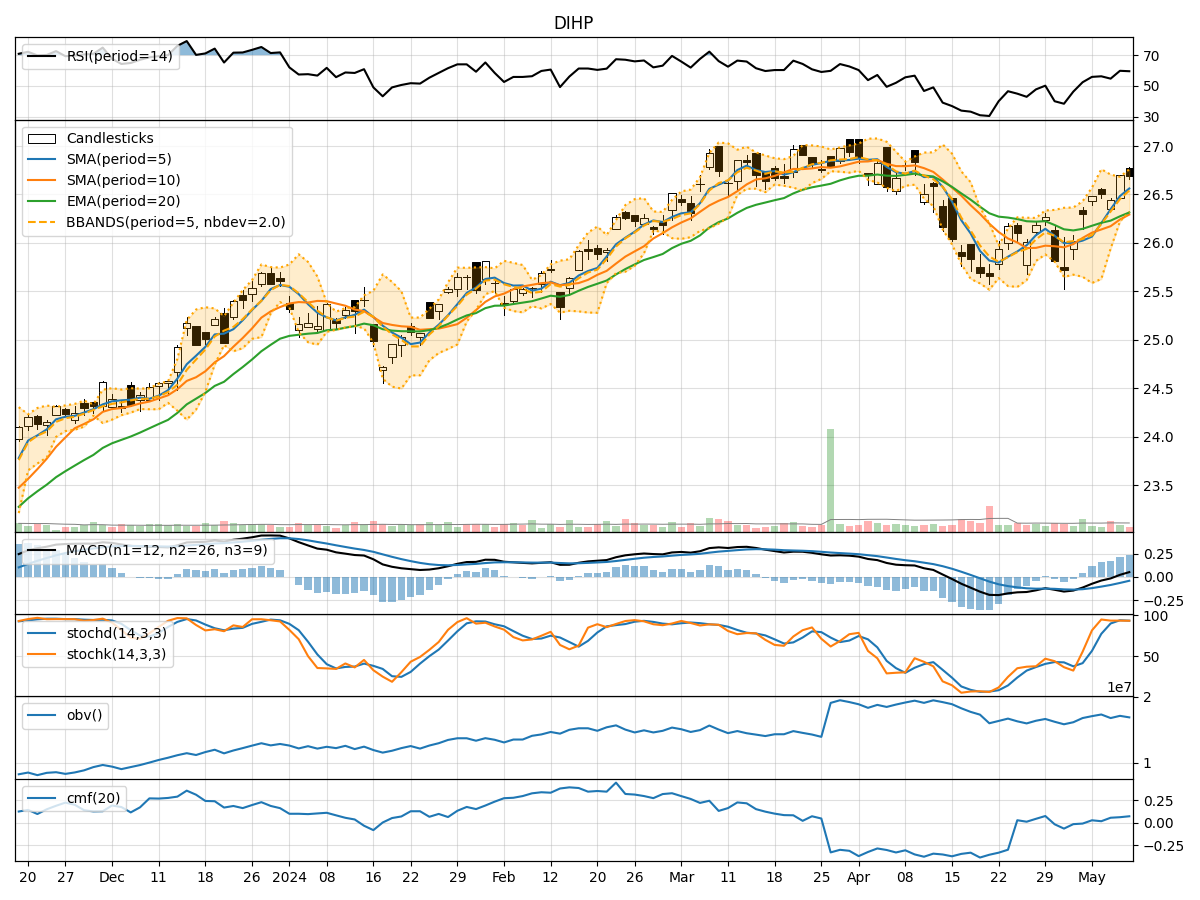
- Moving Averages (MA): The 5-day MA has been fluctuating around the closing prices, indicating a lack of clear trend direction.
- MACD: The MACD line has been hovering around the signal line, suggesting a neutral momentum in the short term.
- EMA: The EMA has shown slight variations but has not provided a strong indication of a trend.
Key Observation: The trend indicators do not show a definitive trend direction, signaling a period of consolidation or sideways movement.
Momentum Analysis:
- RSI: The RSI values have been fluctuating around the mid-level, indicating a balanced momentum between buying and selling pressure.
- Stochastic Oscillator: Both %K and %D values have been moving erratically, failing to provide a clear signal.
- Williams %R: The Williams %R values have been oscillating, reflecting indecision in the market sentiment.
Key Observation: The momentum indicators suggest a lack of strong bullish or bearish momentum, pointing towards a neutral stance.
Volatility Analysis:
- Bollinger Bands (BB): The bands have shown narrow fluctuations, indicating low volatility in the stock price.
- Bollinger Band %B: The %B values have remained close to the midline, reflecting a balanced volatility level.
Key Observation: The volatility indicators suggest a period of low volatility, potentially leading to a range-bound price movement.
Volume Analysis:
- On-Balance Volume (OBV): The OBV values have shown mixed trends, with no clear accumulation or distribution pattern.
- Chaikin Money Flow (CMF): The CMF values have been positive but not significantly strong, indicating a moderate inflow of money.
Key Observation: The volume indicators do not provide a strong indication of significant buying or selling pressure.
Conclusion:
Based on the analysis of the technical indicators, the next few days for DIHP are likely to witness sideways movement with low volatility and neutral momentum. The lack of clear trend direction, coupled with balanced momentum and volume, suggests a period of consolidation. Traders may expect the stock price to trade within a narrow range without any significant upward or downward movement.
Key Conclusion: Consolidation with sideways movement is anticipated in the upcoming days for DIHP.