Technical Analysis of DWLD 2024-05-31
Overview:
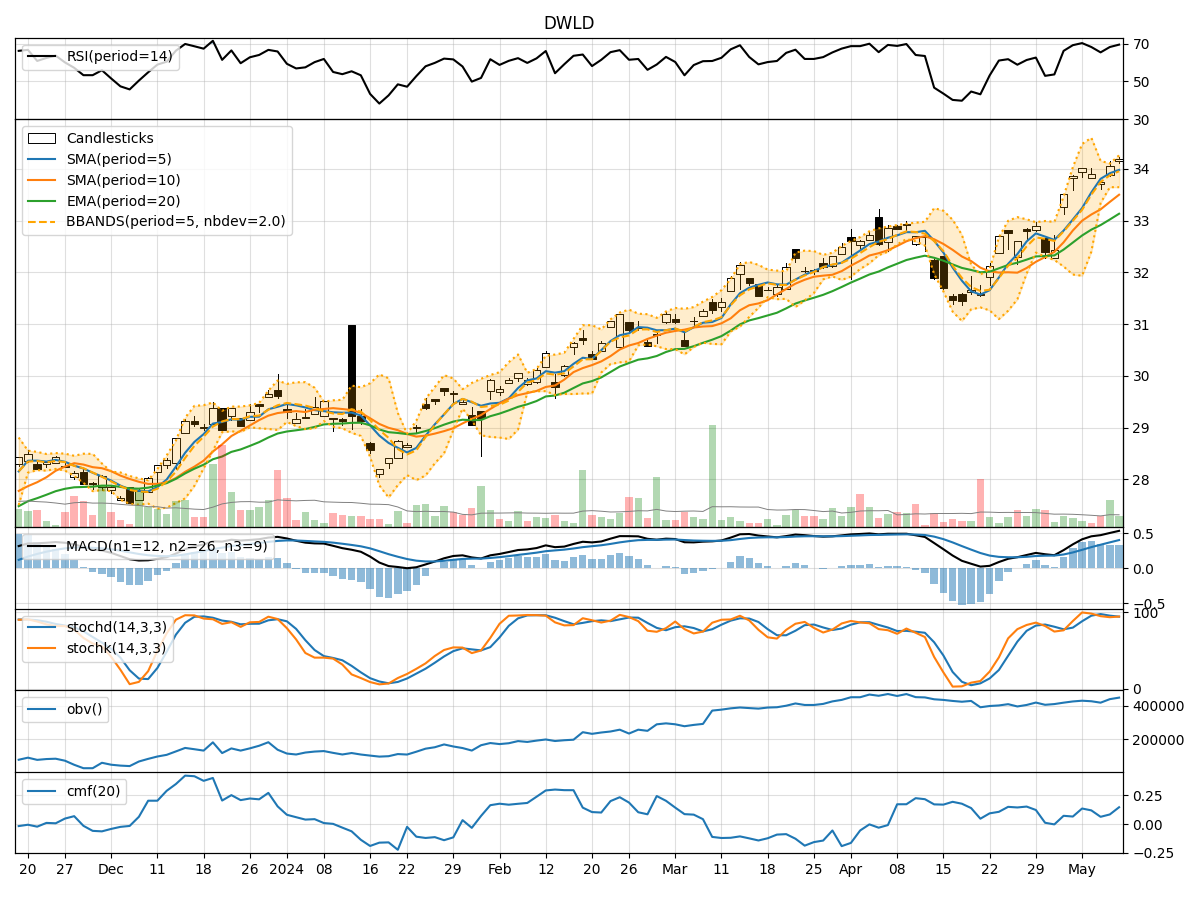
In analyzing the technical indicators for DWLD over the last 5 days, we will delve into the trend, momentum, volatility, and volume indicators to provide a comprehensive outlook on the possible stock price movement in the coming days.
Trend Analysis:
- Moving Averages (MA): The 5-day MA has been consistently below the closing price, indicating a short-term downtrend.
- MACD: The MACD line has been above the signal line, suggesting a bullish momentum.
- EMA: The EMA has been declining, reflecting a bearish sentiment in the stock.
Momentum Analysis:
- RSI: The RSI has been fluctuating around the 50 level, indicating a neutral momentum.
- Stochastic Oscillator: Both %K and %D have been decreasing, signaling a potential bearish momentum.
- Williams %R: The indicator has been in oversold territory, suggesting a possible reversal.
Volatility Analysis:
- Bollinger Bands (BB): The stock price has been trading within the bands, indicating a period of consolidation.
- BB Width: The width of the bands has been narrowing, suggesting decreasing volatility.
- BB %B: The %B indicator has been hovering around the middle, reflecting a balanced market sentiment.
Volume Analysis:
- On-Balance Volume (OBV): The OBV has been fluctuating, indicating indecision among investors.
- Chaikin Money Flow (CMF): The CMF has been relatively stable, showing a neutral money flow trend.
Key Observations:
- The trend indicators suggest a bearish sentiment in the short term.
- Momentum indicators show a lack of strong directional momentum.
- Volatility indicators point towards a period of consolidation.
- Volume indicators reflect indecision among market participants.
Conclusion:
Based on the analysis of the technical indicators, the stock of DWLD is likely to experience sideways movement in the coming days. The lack of strong trends in both momentum and volume, coupled with the consolidation pattern indicated by volatility indicators, suggests a period of indecision and potential range-bound trading. Traders may consider adopting a neutral stance and closely monitor key support and resistance levels for potential breakout opportunities.