Technical Analysis of ECNS 2024-05-31
Overview:
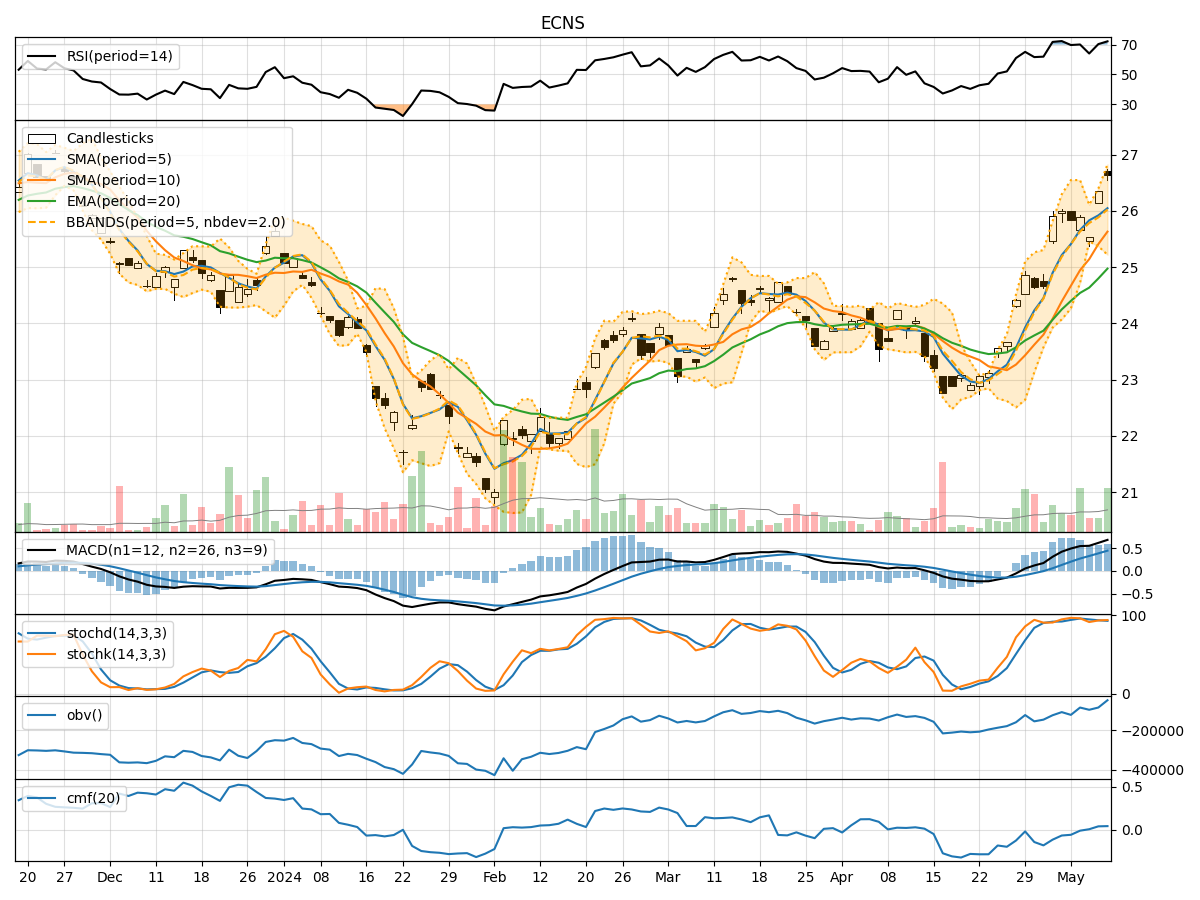
In analyzing the technical indicators for ECNS stock over the last 5 days, we will delve into the trend, momentum, volatility, and volume indicators to provide a comprehensive outlook on the possible stock price movement in the coming days. By examining these key indicators, we aim to offer valuable insights and predictions for potential investors.
Trend Indicators:
- Moving Averages (MA): The 5-day moving average (MA) has been gradually decreasing, indicating a short-term downtrend in the stock price.
- MACD: The MACD line has been decreasing, and the MACD histogram is also showing a downward trend, suggesting a bearish momentum in the stock.
- EMA: The exponential moving average (EMA) has been relatively stable, indicating a potential consolidation phase in the stock price.
Momentum Indicators:
- RSI: The Relative Strength Index (RSI) has been fluctuating around the neutral zone, indicating a lack of strong momentum in either direction.
- Stochastic Oscillator: Both %K and %D lines of the Stochastic Oscillator are trending downwards, signaling a bearish momentum in the stock.
- Williams %R: The Williams %R is in the oversold territory, suggesting a potential reversal or consolidation phase.
Volatility Indicators:
- Bollinger Bands: The Bollinger Bands are narrowing, indicating decreasing volatility in the stock price.
- Bollinger %B: The %B indicator is hovering around the middle range, suggesting a lack of extreme price movements.
Volume Indicators:
- On-Balance Volume (OBV): The OBV has been fluctuating, indicating mixed buying and selling pressure in the stock.
- Chaikin Money Flow (CMF): The CMF is positive, suggesting that money is flowing into the stock despite the recent price decline.
Key Observations and Opinions:
- Trend: The stock is currently in a short-term downtrend based on moving averages and MACD indicators.
- Momentum: Momentum indicators are showing bearish signals, indicating a potential continuation of the downward trend.
- Volatility: Volatility is decreasing, which could lead to a period of consolidation or a potential breakout in the near future.
- Volume: Mixed volume indicators suggest indecision among market participants.
Conclusion:
Based on the analysis of the technical indicators, the outlook for ECNS stock in the next few days is bearish. The trend and momentum indicators point towards a continuation of the current downtrend, while decreasing volatility may lead to a period of consolidation before a potential breakout. Investors should exercise caution and consider waiting for more definitive signals before making any trading decisions.