Technical Analysis of EEMA 2024-05-31
Overview:
In analyzing the technical indicators for EEMA over the last 5 days, we will delve into the trend, momentum, volatility, and volume indicators to provide a comprehensive outlook on the possible stock price movement in the coming days. By examining these key indicators, we aim to offer valuable insights and predictions for informed decision-making.
Trend Analysis:
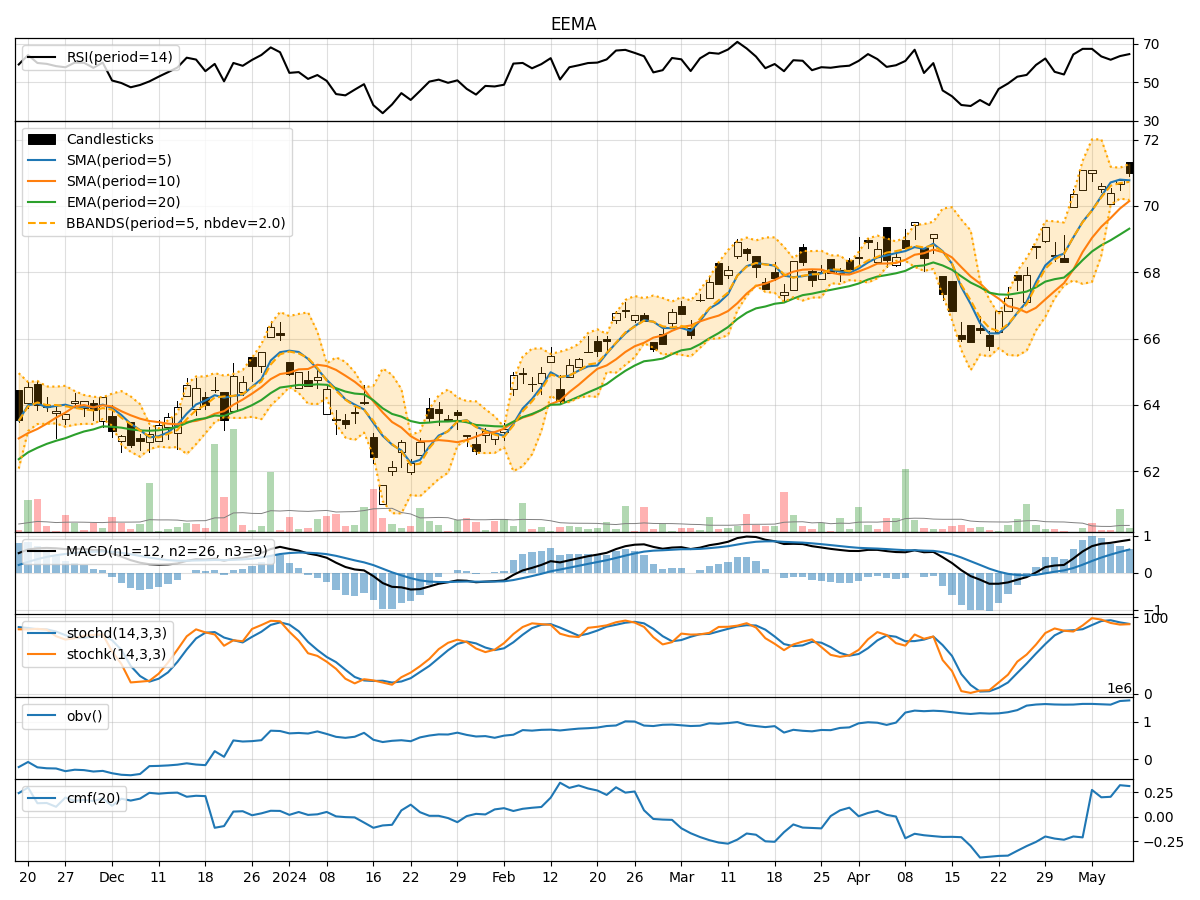
- Moving Averages (MA): The 5-day Moving Average (MA) has been declining gradually, indicating a short-term bearish trend.
- MACD: The MACD line has been consistently below the signal line, suggesting a bearish momentum in the stock.
- EMA: The Exponential Moving Average (EMA) has also been trending downwards, reinforcing the bearish sentiment in the short to medium term.
Momentum Analysis:
- RSI: The Relative Strength Index (RSI) has been decreasing, reflecting a weakening momentum in the stock.
- Stochastic Oscillator: Both %K and %D have been declining, indicating a bearish momentum.
- Williams %R: The Williams %R is in oversold territory, signaling a potential reversal or continuation of the downtrend.
Volatility Analysis:
- Bollinger Bands (BB): The Bollinger Bands have been narrowing, suggesting decreasing volatility in the stock price.
- BB %B: The %B indicator is below 0.2, indicating the stock is oversold and may see a potential bounce back.
Volume Analysis:
- On-Balance Volume (OBV): The OBV has been relatively stable, indicating a balance between buying and selling pressure.
- Chaikin Money Flow (CMF): The CMF has been positive but decreasing, suggesting a slight decrease in buying pressure.
Key Observations:
- The stock is currently in a downtrend based on moving averages and MACD.
- Momentum indicators like RSI and Stochastic Oscillator support the bearish sentiment.
- Volatility has been decreasing, potentially leading to a period of consolidation or a breakout.
- Volume indicators show a balanced buying and selling pressure.
Conclusion:
Based on the analysis of the technical indicators, the next few days for EEMA are likely to see a continuation of the bearish trend with the possibility of a short-term bounce back due to oversold conditions indicated by Williams %R and Bollinger Bands. Traders should exercise caution and consider potential reversal signals in the momentum indicators before making any trading decisions.