Technical Analysis of EEMD 2024-05-31
Overview:
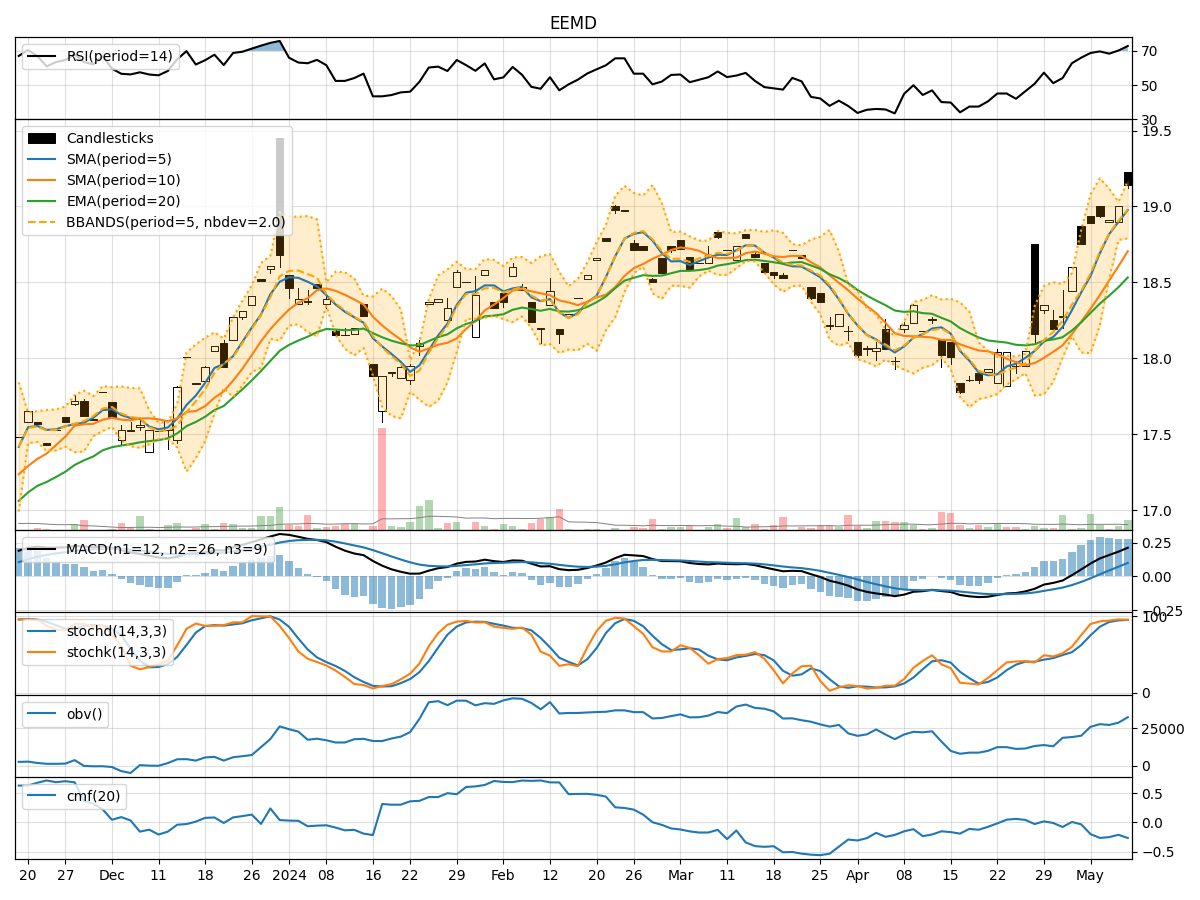
In the last 5 trading days, the EEMD stock has shown mixed signals across various technical indicators. The trend indicators suggest a slight bearish sentiment, with the moving averages and MACD showing a downward trend. Momentum indicators also indicate a weakening momentum, while volatility indicators show a narrowing Bollinger Bands range. Volume indicators suggest a decrease in buying pressure.
Trend Indicators:
- Moving Averages (MA): The 5-day MA is below the 10-day SMA, indicating a short-term bearish trend.
- MACD: The MACD line is below the signal line, suggesting a bearish momentum.
Key Observation: The trend indicators point towards a downward trend in the stock price.
Momentum Indicators:
- RSI: The RSI is below 50, indicating a weakening momentum.
- Stochastic Oscillator: Both %K and %D are trending downwards, signaling a bearish momentum.
Key Observation: Momentum indicators suggest a weakening momentum in the stock.
Volatility Indicators:
- Bollinger Bands (BB): The Bollinger Bands are narrowing, indicating decreasing volatility.
Key Observation: Volatility indicators show a decreasing volatility in the stock price.
Volume Indicators:
- On-Balance Volume (OBV): The OBV is decreasing, suggesting a decrease in buying pressure.
- Chaikin Money Flow (CMF): The CMF is negative, indicating a bearish money flow.
Key Observation: Volume indicators point towards a decrease in buying pressure.
Conclusion:
Based on the analysis of the technical indicators, the next few days' possible stock price movement for EEMD is likely to be downward. The trend indicators, momentum indicators, volatility indicators, and volume indicators collectively suggest a bearish sentiment in the stock. Traders and investors should exercise caution and consider potential short-selling opportunities or wait for a more favorable entry point.