Technical Analysis of EMHY 2024-05-31
Overview:
In analyzing the technical indicators for EMHY stock over the last 5 days, we will delve into the trend, momentum, volatility, and volume indicators to provide a comprehensive outlook on the possible stock price movement in the coming days. By examining these key indicators, we aim to offer valuable insights and predictions for informed decision-making.
Trend Analysis:
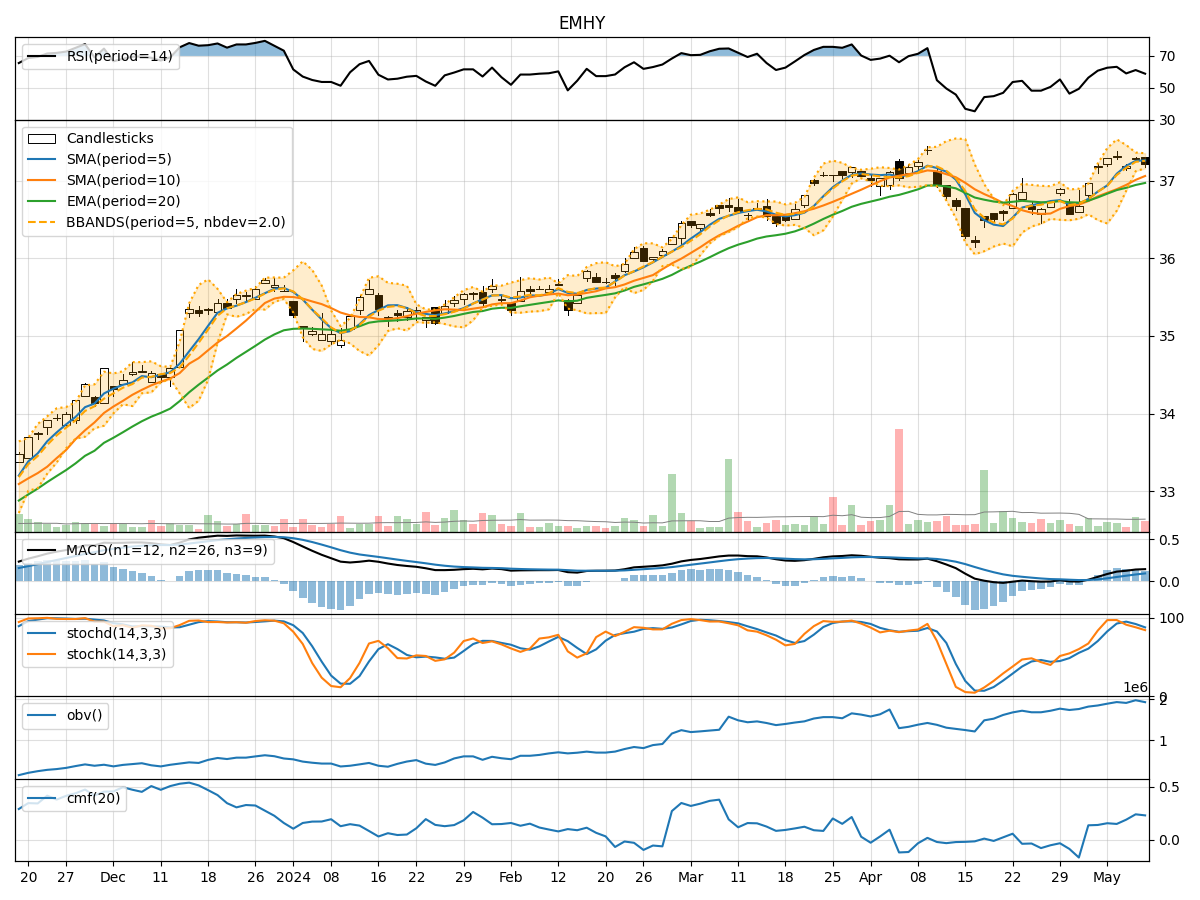
- Moving Averages (MA): The 5-day moving average (MA) has been fluctuating around the closing prices, indicating short-term price trends. The Simple Moving Average (SMA) and Exponential Moving Average (EMA) show a slight downward trend, with the EMA being more sensitive to recent price changes.
- MACD: The Moving Average Convergence Divergence (MACD) and its signal line (MACDH) have been negative, suggesting a bearish momentum in the short term.
Momentum Analysis:
- RSI: The Relative Strength Index (RSI) has been hovering around the neutral zone, indicating a balanced momentum between buying and selling pressure.
- Stochastic Oscillator: Both %K and %D of the Stochastic Oscillator have been relatively low, signaling a potential oversold condition in the market.
- Williams %R: The Williams %R is in the oversold territory, suggesting a possible reversal or bounce in the stock price.
Volatility Analysis:
- Bollinger Bands (BB): The Bollinger Bands show a narrowing range, indicating decreasing volatility in the stock price.
- Bollinger %B: The %B indicator is below 1, suggesting that the stock price is trading below the lower Bollinger Band, potentially indicating an oversold condition.
Volume Analysis:
- On-Balance Volume (OBV): The OBV has been fluctuating, indicating mixed buying and selling pressure in the market.
- Chaikin Money Flow (CMF): The CMF has been positive, suggesting that money is flowing into the stock despite fluctuations in volume.
Conclusion:
Based on the analysis of the technical indicators, the stock is currently exhibiting bearish signals in the short term. The trend indicators show a downward bias, supported by the negative MACD. Momentum indicators suggest a potential oversold condition, while volatility is decreasing, indicating a possible consolidation phase. Volume indicators reflect mixed market sentiment.
Forecast:
Considering the overall technical picture, the next few days may see the stock price continue its downward trajectory or enter a consolidation phase before a potential reversal. Traders should exercise caution and monitor key support levels for potential buying opportunities.