Technical Analysis of EMSF 2024-05-31
Overview:
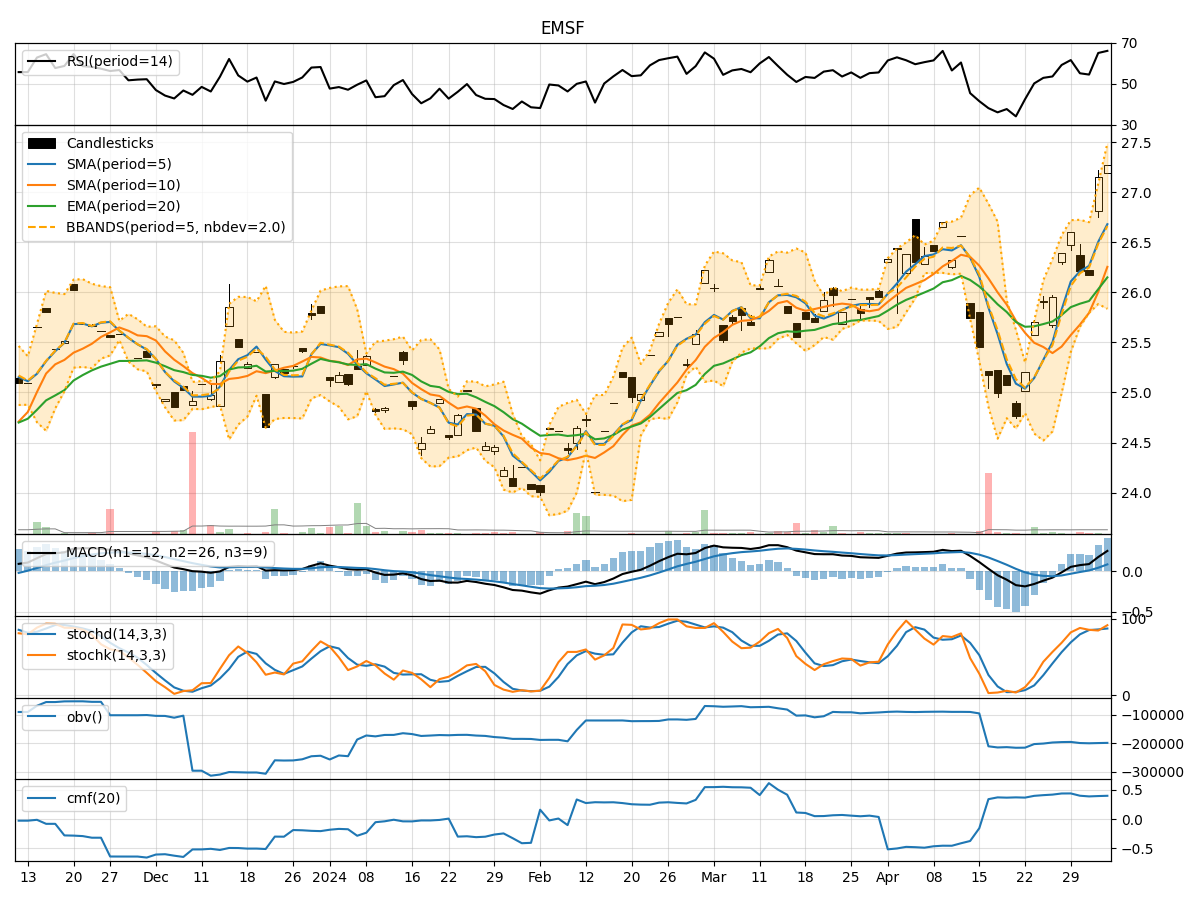
In analyzing the technical indicators for EMSF stock over the last 5 days, we will delve into the trend, momentum, volatility, and volume indicators to provide a comprehensive assessment of the stock's potential price movement. By examining these key factors, we aim to offer valuable insights and predictions for the next few days.
Trend Analysis:
- Moving Averages (MA): The 5-day MA has been gradually decreasing, indicating a short-term bearish trend.
- MACD: The MACD line has been consistently below the signal line, suggesting a bearish momentum.
- EMA: The EMA has also been declining, aligning with the bearish sentiment in the short term.
Key Observation: The trend indicators point towards a bearish outlook for EMSF stock in the short term.
Momentum Analysis:
- RSI: The RSI has been fluctuating around the 50 level, indicating a lack of strong momentum in either direction.
- Stochastic Oscillator: Both %K and %D have been trending downwards, signaling weakening momentum.
- Williams %R: The indicator has been consistently in the oversold territory, reflecting bearish sentiment.
Key Observation: Momentum indicators suggest a lack of strong bullish momentum and a prevailing bearish sentiment.
Volatility Analysis:
- Bollinger Bands (BB): The bands have been narrowing, indicating decreasing volatility.
- Bollinger %B: The %B has been hovering around the middle, reflecting a neutral stance.
- Bollinger Band Width: The band width has been contracting, signaling reduced price volatility.
Key Observation: Volatility indicators suggest a period of consolidation and reduced price fluctuations.
Volume Analysis:
- On-Balance Volume (OBV): The OBV has been declining, indicating selling pressure in the stock.
- Chaikin Money Flow (CMF): The CMF has been negative, reflecting a lack of buying interest.
Key Observation: Volume indicators point towards a bearish sentiment with more selling pressure than buying interest.
Conclusion:
Based on the analysis of trend, momentum, volatility, and volume indicators, the overall outlook for EMSF stock in the next few days is bearish. The trend indicators, momentum signals, and volume analysis all align in suggesting a downward movement in the stock price. The lack of strong bullish momentum, coupled with decreasing volatility and selling pressure, indicates a potential continuation of the bearish trend.
Key Conclusion: The next few days are likely to see a downward movement in EMSF stock price. Investors should exercise caution and consider potential shorting opportunities or wait for a more favorable entry point.