Technical Analysis of ESGE 2024-05-31
Overview:
In analyzing the technical indicators for ESGE stock over the last 5 days, we will delve into the trend, momentum, volatility, and volume indicators to provide a comprehensive outlook on the possible stock price movement in the upcoming days. By examining these key indicators, we aim to offer valuable insights and predictions for potential investors.
Trend Analysis:
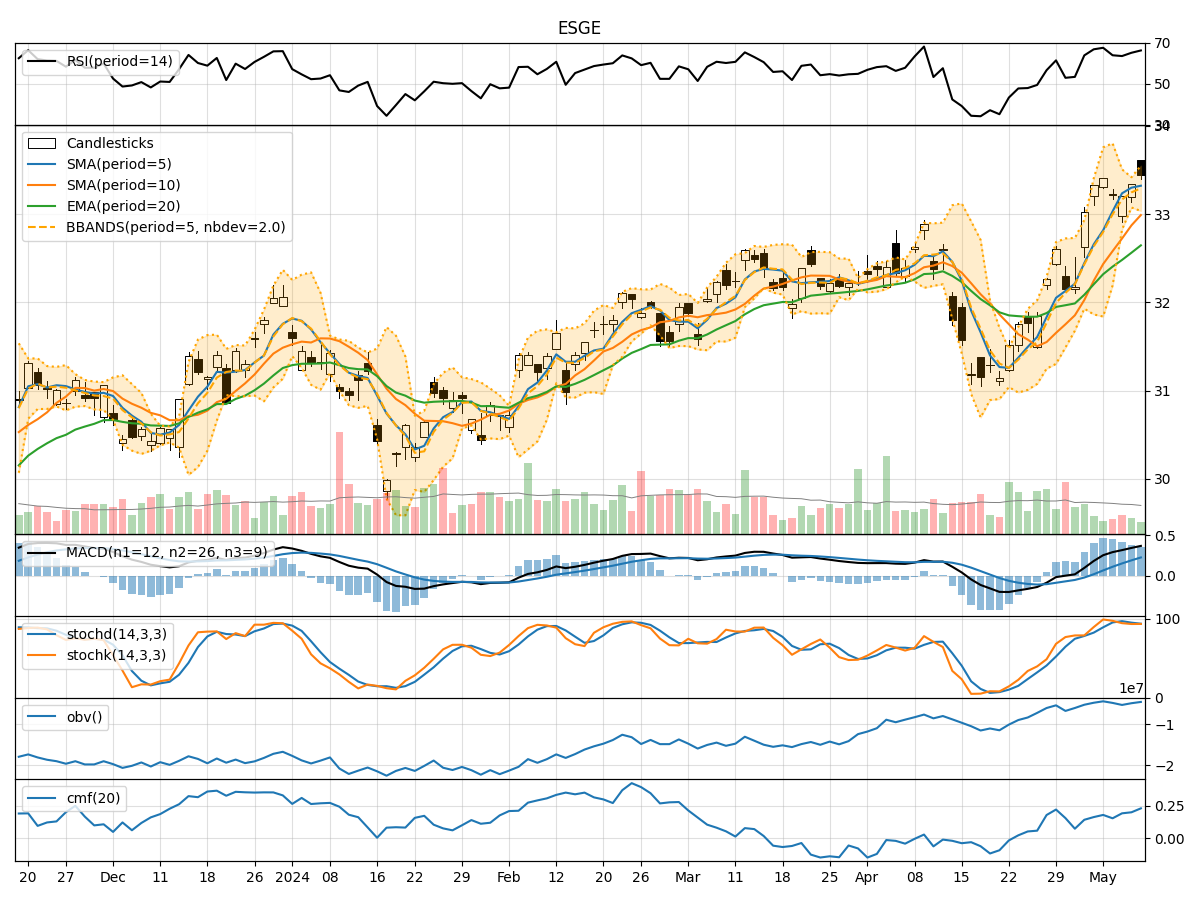
- Moving Averages (MA): The 5-day Moving Average (MA) has been consistently decreasing, indicating a downward trend in the stock price.
- MACD: The MACD line has been decreasing, and the MACD Histogram has been consistently negative, suggesting a bearish momentum in the stock.
- EMA: The Exponential Moving Average (EMA) has also been declining, further supporting the bearish trend in the stock.
Momentum Analysis:
- RSI: The Relative Strength Index (RSI) has been decreasing, indicating a weakening momentum in the stock.
- Stochastic Oscillator: Both %K and %D of the Stochastic Oscillator have been decreasing, signaling a bearish momentum.
- Williams %R: The Williams %R indicator has been in the oversold territory, suggesting a potential reversal or continuation of the downtrend.
Volatility Analysis:
- Bollinger Bands: The Bollinger Bands have been narrowing, indicating decreasing volatility in the stock price.
- Bollinger %B: The %B indicator has been hovering around the lower band, suggesting a possible oversold condition.
- Average True Range (ATR): The ATR has been decreasing, indicating a decline in price volatility.
Volume Analysis:
- On-Balance Volume (OBV): The OBV has been decreasing, indicating a potential distribution phase in the stock.
- Chaikin Money Flow (CMF): The CMF has been fluctuating but overall showing a slight positive trend, suggesting some buying pressure.
Key Observations and Opinions:
- Trend: The trend indicators, including moving averages and MACD, all point towards a bearish outlook for the stock.
- Momentum: The momentum indicators, such as RSI and Stochastic Oscillator, also support a bearish sentiment.
- Volatility: Volatility has been decreasing, which could indicate a period of consolidation or a potential breakout in the near future.
- Volume: The declining OBV suggests a lack of buying interest, while the CMF shows some positive buying pressure but not strong enough to reverse the current trend.
Conclusion:
Based on the analysis of the technical indicators, the next few days' possible stock price movement for ESGE is likely to be downward. The overall trend, momentum, and volume indicators all point towards a bearish sentiment in the stock. Traders and investors should exercise caution and consider waiting for a more favorable entry point or potential reversal signals before considering any long positions.