Technical Analysis of ESGY 2024-05-31
Overview:
In analyzing the technical indicators for ESGY over the last 5 days, we will delve into the trend, momentum, volatility, and volume indicators to provide a comprehensive outlook on the possible stock price movement in the coming days. By examining these key aspects, we aim to offer valuable insights and predictions for informed decision-making.
Trend Analysis:
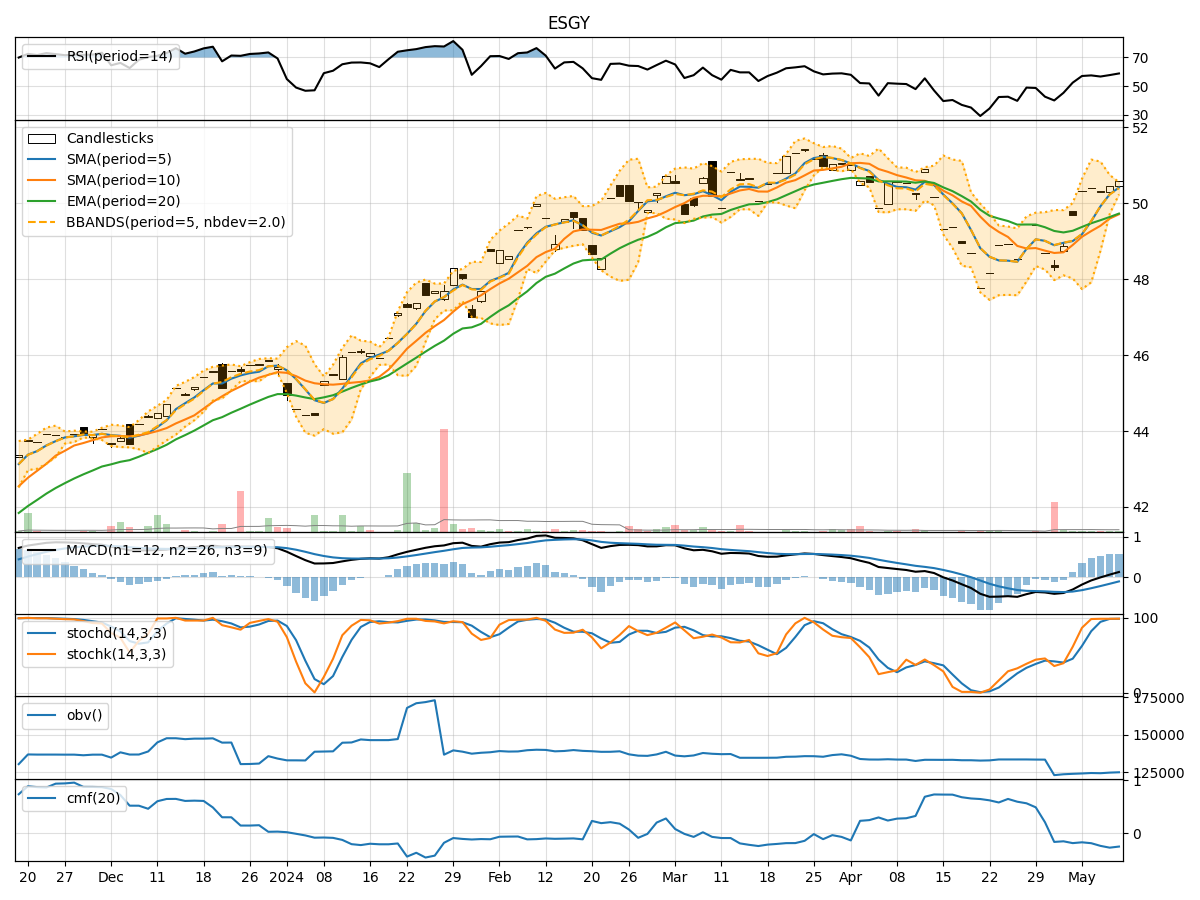
- Moving Averages (MA): The 5-day Moving Average (MA) has been fluctuating around the closing prices, indicating short-term price trends. The Simple Moving Average (SMA) and Exponential Moving Average (EMA) have shown a slight upward trend, suggesting a potential bullish sentiment.
- MACD: The Moving Average Convergence Divergence (MACD) has been positive, with the MACD line consistently above the signal line. This signals a bullish momentum in the stock price.
- Conclusion: The trend indicators suggest an upward momentum in the stock price.
Momentum Analysis:
- RSI: The Relative Strength Index (RSI) has been fluctuating but generally staying within the neutral range, indicating balanced buying and selling pressure.
- Stochastic Oscillator: Both %K and %D have shown fluctuations but have not entered extreme overbought or oversold territories.
- Conclusion: The momentum indicators suggest a neutral stance in the stock price movement.
Volatility Analysis:
- Bollinger Bands (BB): The Bollinger Bands have widened, indicating increased price volatility. The bands have not shown any significant squeeze or expansion patterns.
- Conclusion: The volatility indicators suggest increased volatility in the stock price.
Volume Analysis:
- On-Balance Volume (OBV): The OBV has shown mixed signals, with some days recording negative values, indicating distribution.
- Chaikin Money Flow (CMF): The CMF has been negative, suggesting selling pressure in the stock.
- Conclusion: The volume indicators suggest a bearish sentiment in the stock price.
Overall Conclusion:
Based on the analysis of the technical indicators, the stock of ESGY is likely to experience increased volatility in the coming days. While the trend indicators point towards an upward momentum, the volume indicators indicate a bearish sentiment. The momentum indicators suggest a neutral stance, reflecting a balanced buying and selling pressure.
Considering the mixed signals from the different indicators, it is crucial for investors to exercise caution and closely monitor the price movements. Traders may consider implementing risk management strategies to navigate the potential volatility in the stock price.