Technical Analysis of EWL 2024-05-31
Overview:
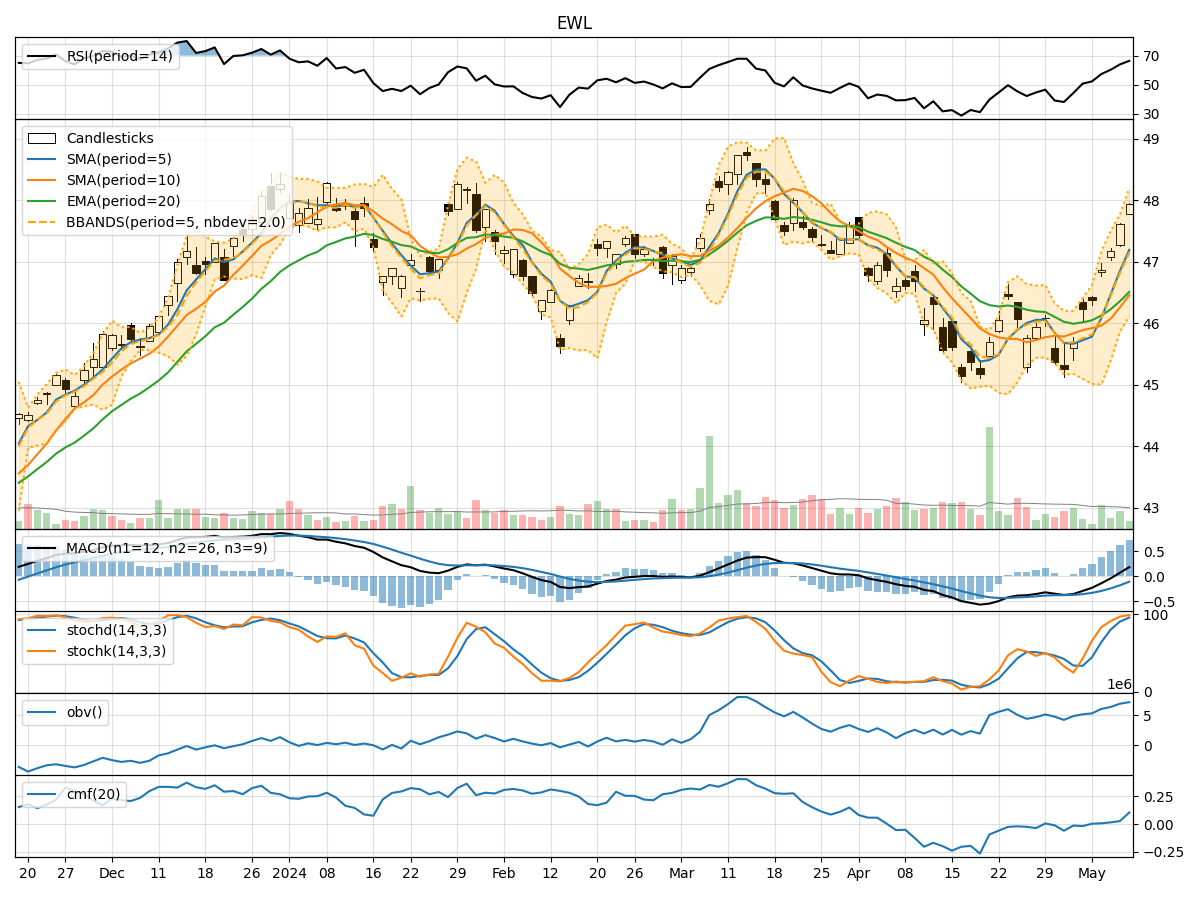
In analyzing the technical indicators for EWL over the last 5 days, we will delve into the trend, momentum, volatility, and volume indicators to provide a comprehensive outlook on the possible stock price movement. By examining these key factors, we aim to offer valuable insights and predictions for the upcoming trading days.
Trend Analysis:
- Moving Averages (MA): The 5-day MA has been fluctuating around the closing prices, indicating a short-term trend. The SMA(10) and EMA(20) have shown slight variations but have generally followed the price movements.
- MACD: The MACD line has been positive, indicating a bullish momentum, although the MACD Histogram has shown some fluctuations.
- Conclusion: The trend indicators suggest a slightly bullish sentiment in the short term.
Momentum Analysis:
- RSI: The RSI has been oscillating around the 50 level, indicating a neutral momentum.
- Stochastic Oscillator: Both %K and %D have shown mixed signals, with %K hovering around the overbought territory.
- Williams %R: The Williams %R has been fluctuating, showing indecision in momentum.
- Conclusion: The momentum indicators suggest a neutral to slightly bearish sentiment.
Volatility Analysis:
- Bollinger Bands (BB): The bands have shown some contraction, indicating a decrease in volatility.
- Conclusion: The volatility indicators suggest a decreasing volatility environment.
Volume Analysis:
- On-Balance Volume (OBV): The OBV has shown mixed movements, indicating indecision among market participants.
- Chaikin Money Flow (CMF): The CMF has been positive, suggesting some buying pressure.
- Conclusion: The volume indicators suggest mixed signals in terms of market participation.
Overall Conclusion:
Based on the analysis of the technical indicators, the next few days' possible stock price movement for EWL is likely to be sideways with a slightly bullish bias. The trend indicators point towards a bullish sentiment in the short term, while the momentum indicators suggest a neutral to slightly bearish momentum. The decreasing volatility indicates a potential consolidation phase, and the mixed volume signals imply indecision among market participants.
Recommendation:
- Short-term Traders: Consider taking advantage of potential short-term bullish opportunities but remain cautious of the neutral to slightly bearish momentum signals.
- Long-term Investors: Monitor the price action closely for a clearer trend confirmation before making significant investment decisions.
- Risk Management: Implement appropriate stop-loss strategies to mitigate risks in the current uncertain market environment.
By combining insights from trend, momentum, volatility, and volume indicators, investors can make more informed decisions and adapt their strategies to the evolving market dynamics. Remember to stay updated on market developments and adjust your approach accordingly to navigate the fluctuations effectively.