Technical Analysis of EZM 2024-05-31
Overview:
In analyzing the technical indicators for the stock EZM over the last 5 days, we will delve into the trends, momentum, volatility, and volume indicators to provide a comprehensive outlook on the possible stock price movement in the coming days. By examining these key indicators, we aim to offer valuable insights and recommendations for potential investors.
Trend Indicators:
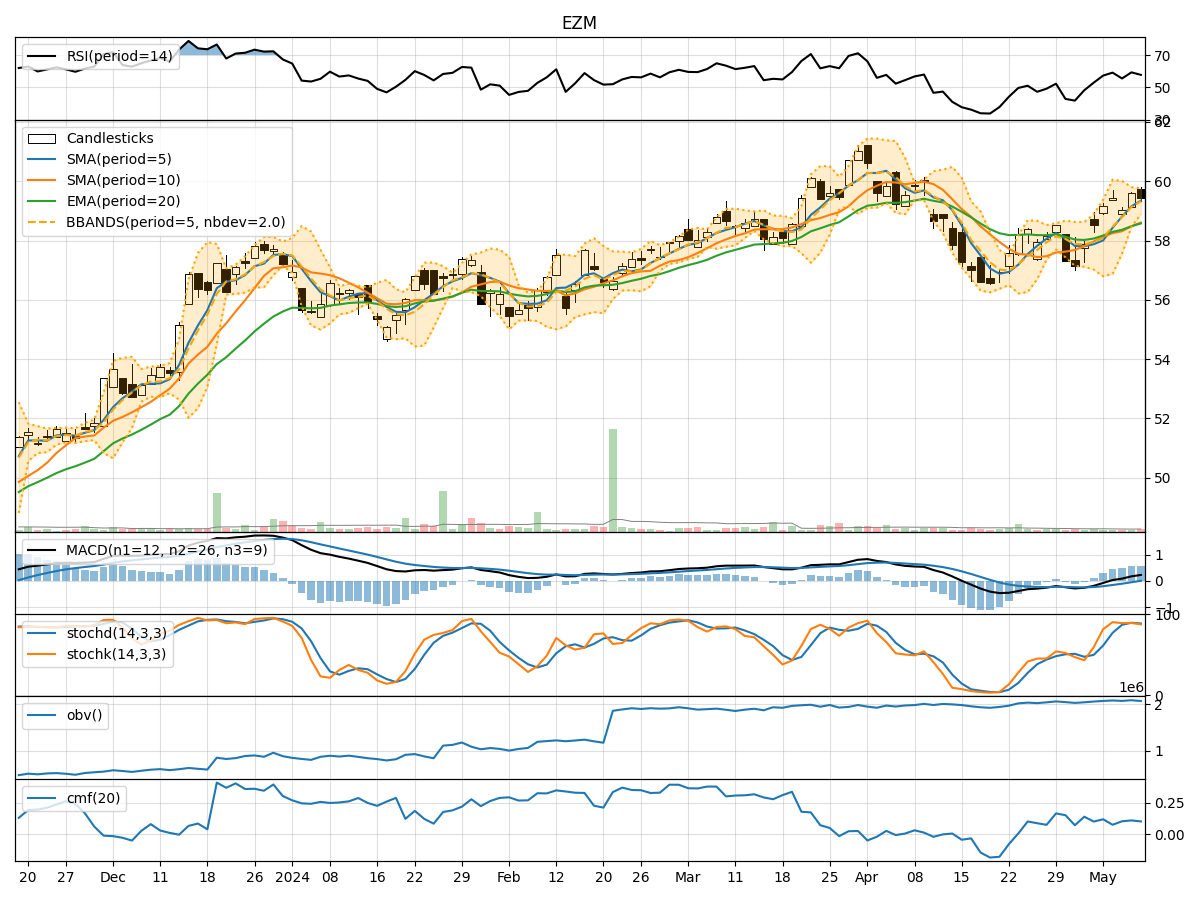
- Moving Averages (MA): The 5-day MA has been consistently below the closing prices, indicating a short-term downtrend.
- MACD: The MACD line has been below the signal line, suggesting a bearish momentum.
- EMA: The EMA has been declining, reflecting a weakening trend.
Momentum Indicators:
- RSI: The RSI has been fluctuating around the 50 level, indicating a lack of strong momentum.
- Stochastic Oscillator: Both %K and %D have been relatively low, signaling a potential oversold condition.
- Williams %R: The indicator has been in the oversold territory, suggesting a bearish sentiment.
Volatility Indicators:
- Bollinger Bands (BB): The bands have been narrowing, indicating decreasing volatility.
- BB %B: The %B has been fluctuating within a narrow range, suggesting a lack of significant price movement.
Volume Indicators:
- On-Balance Volume (OBV): The OBV has shown mixed signals, reflecting indecision among market participants.
- Chaikin Money Flow (CMF): The CMF has been negative, indicating selling pressure.
Key Observations and Opinions:
- Trend: The stock is currently in a short-term downtrend based on moving averages and MACD analysis.
- Momentum: Momentum indicators suggest a lack of strong buying interest and potential oversold conditions.
- Volatility: Volatility has been decreasing, indicating a possible period of consolidation.
- Volume: Mixed signals from volume indicators imply uncertainty in market sentiment.
Conclusion:
Based on the analysis of the technical indicators, the stock EZM is likely to experience further downside movement in the coming days. The overall trend, momentum, and volume signals point towards a bearish outlook. Investors should exercise caution and consider waiting for more definitive signals before making any trading decisions.