Technical Analysis of FAUG 2024-05-31
Overview:
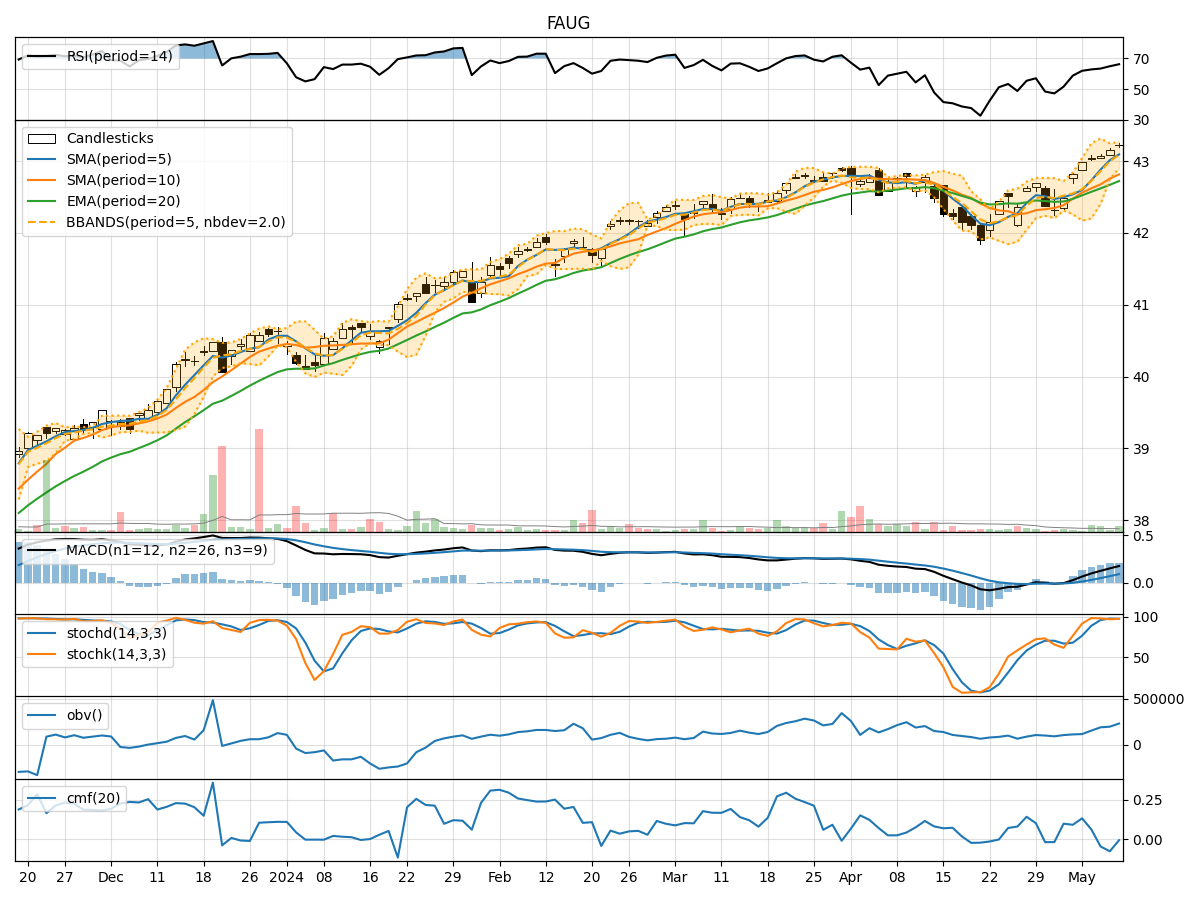
In analyzing the technical indicators for FAUG over the last 5 days, we will delve into the trend, momentum, volatility, and volume indicators to provide a comprehensive outlook on the possible stock price movement in the upcoming days.
Trend Indicators:
- Moving Averages (MA): The 5-day MA has been relatively stable around the current price, indicating a short-term equilibrium.
- MACD: The MACD line has been positive, suggesting a bullish momentum in the stock.
- RSI: The RSI has been fluctuating but generally staying within the neutral range, indicating a balanced buying and selling pressure.
Momentum Indicators:
- Stochastic Oscillator: The stochastic indicators have been declining, signaling a potential weakening of the bullish momentum.
- Williams %R (Willr): The Williams %R has been fluctuating in the oversold and neutral zones, reflecting indecision in the market sentiment.
Volatility Indicators:
- Bollinger Bands (BB): The Bollinger Bands have been narrowing, indicating decreasing volatility and a possible upcoming breakout.
- Average True Range (ATR): The ATR has been relatively stable, suggesting a consistent price range.
Volume Indicators:
- On-Balance Volume (OBV): The OBV has shown a slight increase, indicating a potential accumulation of the stock.
- Chaikin Money Flow (CMF): The CMF has been positive, suggesting buying pressure in the market.
Key Observations:
- The trend indicators show a neutral to slightly bullish sentiment.
- Momentum indicators indicate a potential weakening of the bullish momentum.
- Volatility indicators suggest a potential breakout due to narrowing Bollinger Bands.
- Volume indicators point towards a slight accumulation of the stock.
Conclusion:
Based on the analysis of the technical indicators, the stock price of FAUG is likely to experience sideways consolidation in the upcoming days. The trend remains relatively stable, with a slight bullish bias, but the momentum indicators suggest a potential slowdown in the bullish momentum. The narrowing Bollinger Bands indicate a possible breakout, while volume indicators show a mild accumulation. Therefore, it is recommended to exercise caution and closely monitor the price action for any potential shifts in market sentiment.