Technical Analysis of FCVT 2024-05-31
Overview:
In analyzing the technical indicators for FCVT over the last 5 days, we will delve into the trend, momentum, volatility, and volume indicators to provide a comprehensive outlook on the possible stock price movement. By examining these key aspects, we aim to offer valuable insights and predictions for the upcoming days.
Trend Indicators:
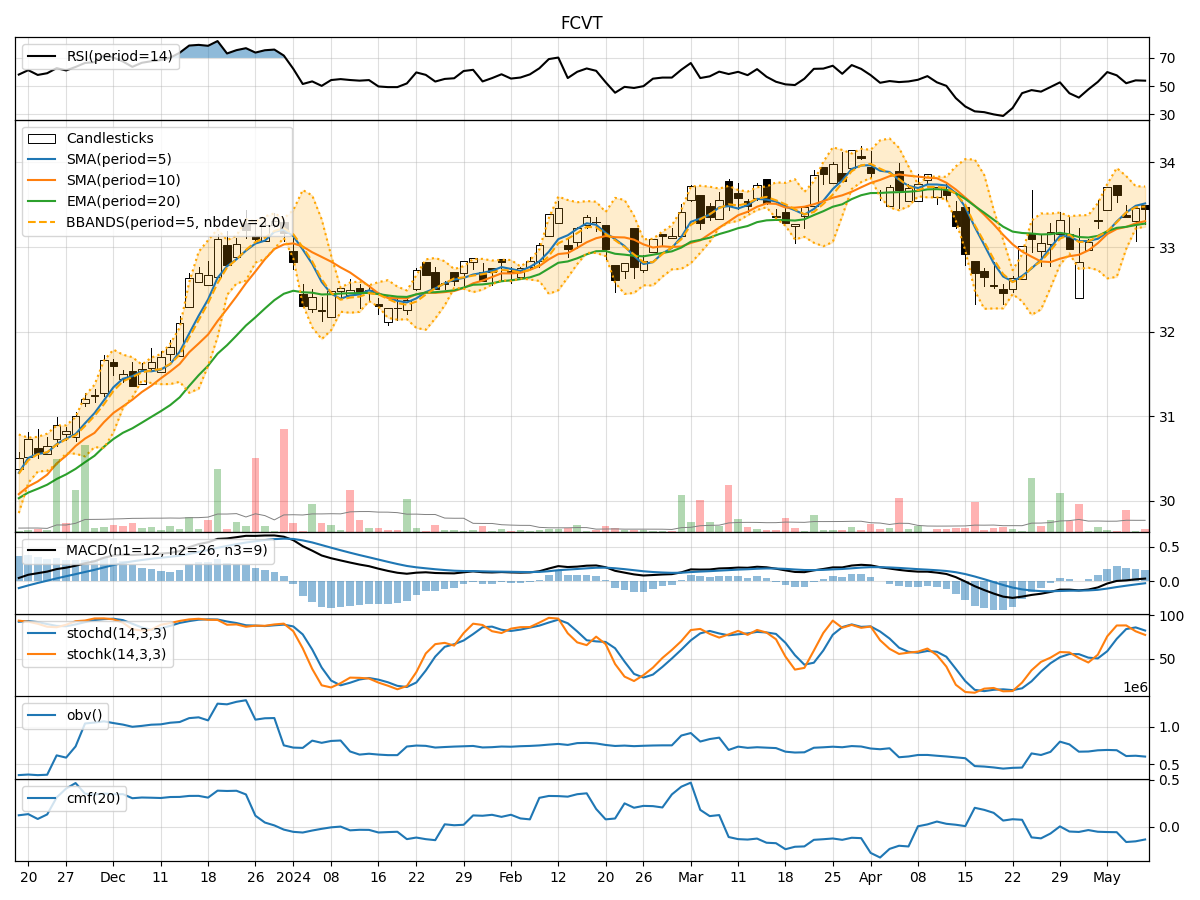
- Moving Averages (MA): The 5-day MA has been fluctuating around the closing prices, indicating short-term price trends. The SMA(10) and EMA(20) have shown slight variations but have generally followed the price movements.
- MACD: The MACD line has been positive, indicating a bullish trend, with the MACD histogram showing some fluctuations but generally staying above the zero line.
Momentum Indicators:
- RSI: The RSI has been fluctuating around the 50 level, suggesting a balanced momentum between buying and selling pressure.
- Stochastic Oscillator: Both %K and %D have shown a downward trend, indicating a potential shift towards oversold conditions.
- Williams %R: The indicator has been moving towards oversold territory, suggesting a bearish sentiment.
Volatility Indicators:
- Bollinger Bands: The bands have been narrowing, indicating decreasing volatility in the stock price. The current price is within the bands, suggesting a period of consolidation.
- Bollinger %B: The %B indicator has been fluctuating around the midline, indicating a lack of clear trend direction.
Volume Indicators:
- On-Balance Volume (OBV): The OBV has been declining, suggesting selling pressure in the stock.
- Chaikin Money Flow (CMF): The CMF has been negative, indicating a lack of buying interest in the stock.
Key Observations and Opinions:
- Trend: The trend indicators show a mixed picture, with the MACD indicating a bullish sentiment while the moving averages show some indecision in the short term.
- Momentum: Momentum indicators suggest a potential shift towards oversold conditions, indicating a bearish bias in the short term.
- Volatility: Volatility has been decreasing, leading to a period of consolidation in the stock price.
- Volume: The declining OBV and negative CMF point towards selling pressure and a lack of buying interest in the stock.
Conclusion:
Based on the analysis of the technical indicators, the next few days for FCVT are likely to see sideways movement with a bearish bias. The stock may continue to consolidate within a narrow range, with a potential downside bias due to the momentum indicators pointing towards oversold conditions. Traders should exercise caution and consider waiting for clearer signals before making any significant trading decisions.