Technical Analysis of FDHT 2024-05-31
Overview:
In analyzing the technical indicators for FDHT over the last 5 days, we will delve into the trend, momentum, volatility, and volume indicators to provide a comprehensive outlook on the possible stock price movement in the coming days. By examining these key indicators, we aim to offer valuable insights and recommendations for potential investors.
Trend Analysis:
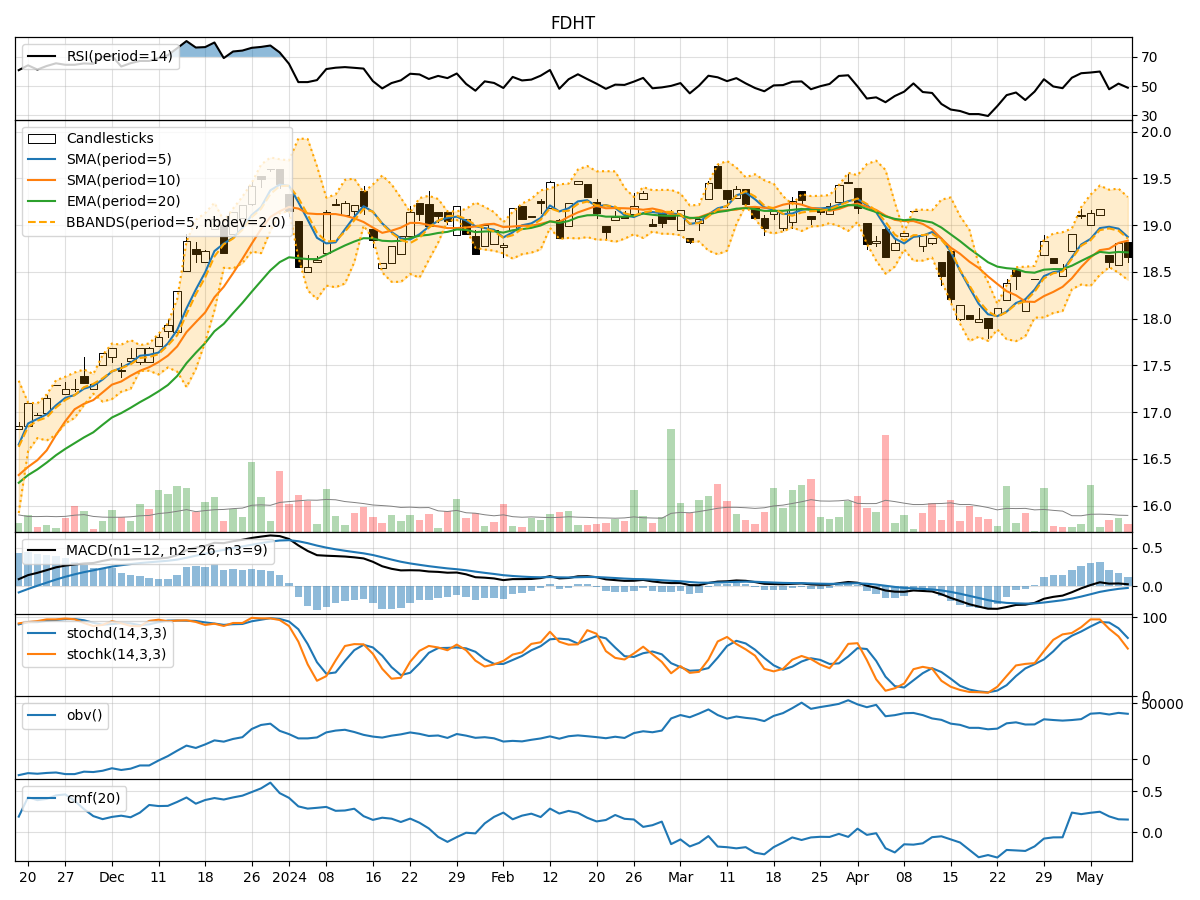
- Moving Averages (MA): The 5-day MA has been fluctuating around the closing prices, indicating a lack of clear trend direction.
- MACD: The MACD line has been positive, suggesting a bullish momentum, although the MACD histogram has been decreasing, signaling a potential weakening of the bullish momentum.
- RSI: The RSI values have been hovering around the mid-range, indicating a neutral sentiment in terms of price momentum.
Momentum Analysis:
- Stochastic Oscillator: The Stochastic indicators have been fluctuating, with the %K and %D values not showing a clear trend direction.
- Williams %R: The Williams %R values have been consistently in the oversold territory, suggesting a potential reversal or consolidation phase.
Volatility Analysis:
- Bollinger Bands (BB): The Bollinger Bands have been narrowing, indicating decreasing volatility and a potential upcoming breakout or significant price movement.
- Average True Range (ATR): The ATR values have been relatively stable, suggesting a lack of significant price volatility.
Volume Analysis:
- On-Balance Volume (OBV): The OBV values have been fluctuating, indicating mixed buying and selling pressure.
- Chaikin Money Flow (CMF): The CMF values have been relatively stable, suggesting a balanced flow of money into and out of the stock.
Key Observations and Opinions:
- Trend: The trend indicators show a lack of clear direction, with mixed signals from the moving averages and MACD. This suggests a potential consolidation phase.
- Momentum: The momentum indicators indicate a neutral sentiment, with no strong bullish or bearish signals.
- Volatility: The narrowing Bollinger Bands suggest a potential breakout, while the stable ATR values indicate low volatility.
- Volume: The volume indicators show mixed buying and selling pressure, with no clear dominance from either side.
Conclusion:
Based on the analysis of the technical indicators, the stock price of FDHT is likely to experience sideways movement in the coming days. The lack of clear trend direction, neutral momentum, decreasing volatility, and mixed volume signals all point towards a period of consolidation. Investors should exercise caution and wait for clearer signals before making significant trading decisions.