Technical Analysis of FDLO 2024-05-31
Overview:
In analyzing the technical indicators for FDLO stock over the last 5 days, we will delve into the trends, momentum, volatility, and volume indicators to provide a comprehensive outlook on the possible future stock price movement. By examining these key aspects, we aim to offer valuable insights and predictions for the upcoming trading days.
Trend Analysis:
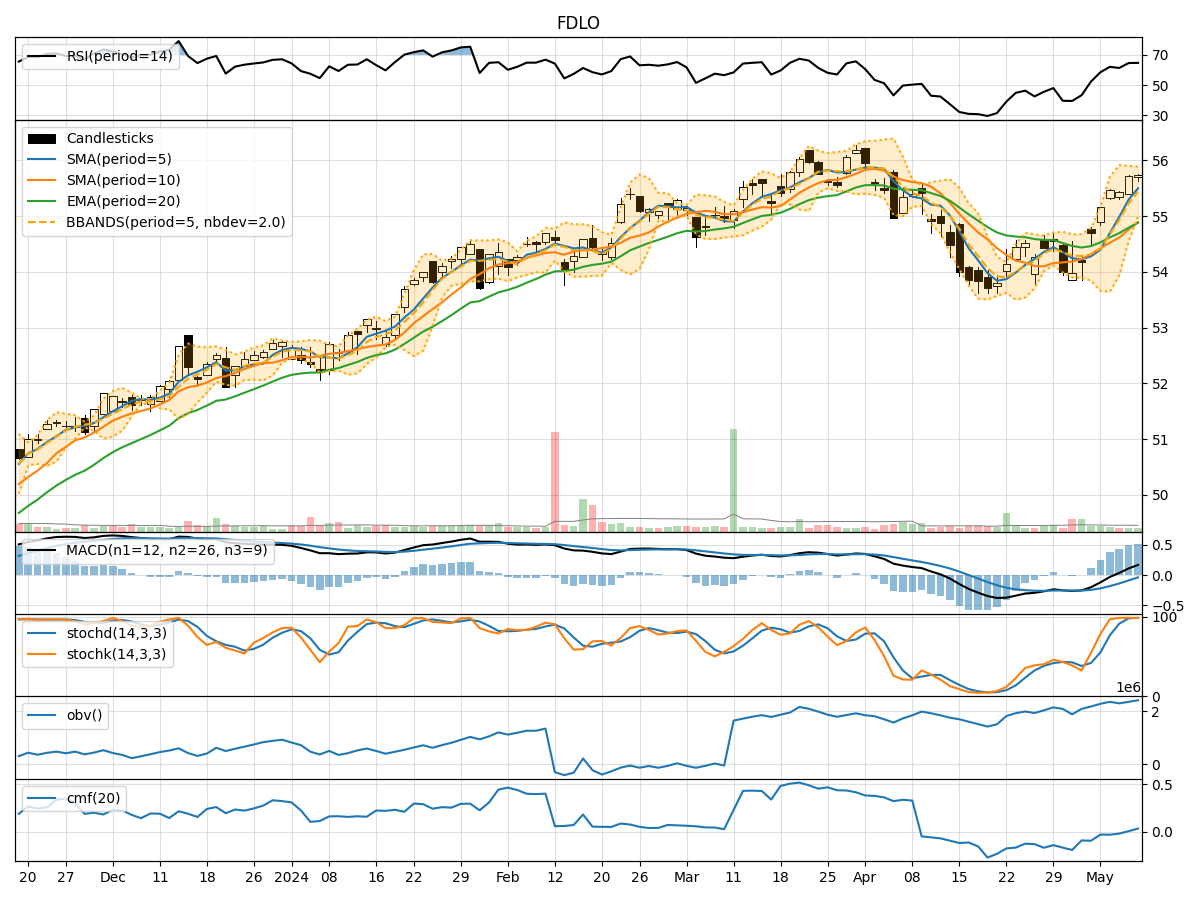
- Moving Averages (MA): The 5-day Moving Average (MA) has been consistently below the closing prices, indicating a short-term downtrend.
- MACD: The MACD line has been positive but decreasing, while the MACD Histogram has been negative, suggesting a potential reversal or weakening of the current uptrend.
- EMA: The Exponential Moving Average (EMA) has been declining, reflecting a bearish sentiment in the stock.
Momentum Analysis:
- RSI: The Relative Strength Index (RSI) has been fluctuating around the neutral zone, indicating indecision among traders.
- Stochastic Oscillator: Both %K and %D have been in oversold territory, signaling a potential reversal to the upside.
- Williams %R: The Williams %R has been in oversold territory, suggesting a possible buying opportunity.
Volatility Analysis:
- Bollinger Bands (BB): The Bollinger Bands have been narrowing, indicating decreasing volatility and a potential breakout in the near future.
- BB %B: The %B indicator has been hovering around the lower band, suggesting a possible oversold condition.
Volume Analysis:
- On-Balance Volume (OBV): The OBV has been relatively stable, indicating a balance between buying and selling pressure.
- Chaikin Money Flow (CMF): The CMF has been positive, reflecting accumulation in the stock over the past 20 days.
Key Observations and Opinions:
- Trend: The trend indicators suggest a short-term bearish outlook for FDLO stock.
- Momentum: The momentum indicators show mixed signals, with a potential for a bullish reversal based on stochastic and Williams %R.
- Volatility: The narrowing Bollinger Bands indicate a period of consolidation, possibly before a breakout.
- Volume: The volume indicators point towards a balanced market sentiment with slight accumulation.
Conclusion:
Based on the analysis of the technical indicators, the next few days for FDLO stock could see sideways movement with a potential for a bullish reversal. Traders should closely monitor the stochastic oscillator and Williams %R for signs of a trend reversal. Additionally, the narrowing Bollinger Bands suggest a breakout is imminent, which could lead to increased volatility in the stock price. Overall, a cautious approach with a bullish bias is recommended for the upcoming trading sessions.