Technical Analysis of FEBT 2024-05-31
Overview:
In analyzing the technical indicators for FEBT over the last 5 days, we will delve into the trend, momentum, volatility, and volume indicators to provide a comprehensive outlook on the possible stock price movement. By examining these key aspects, we aim to offer valuable insights and predictions for the upcoming days.
Trend Analysis:
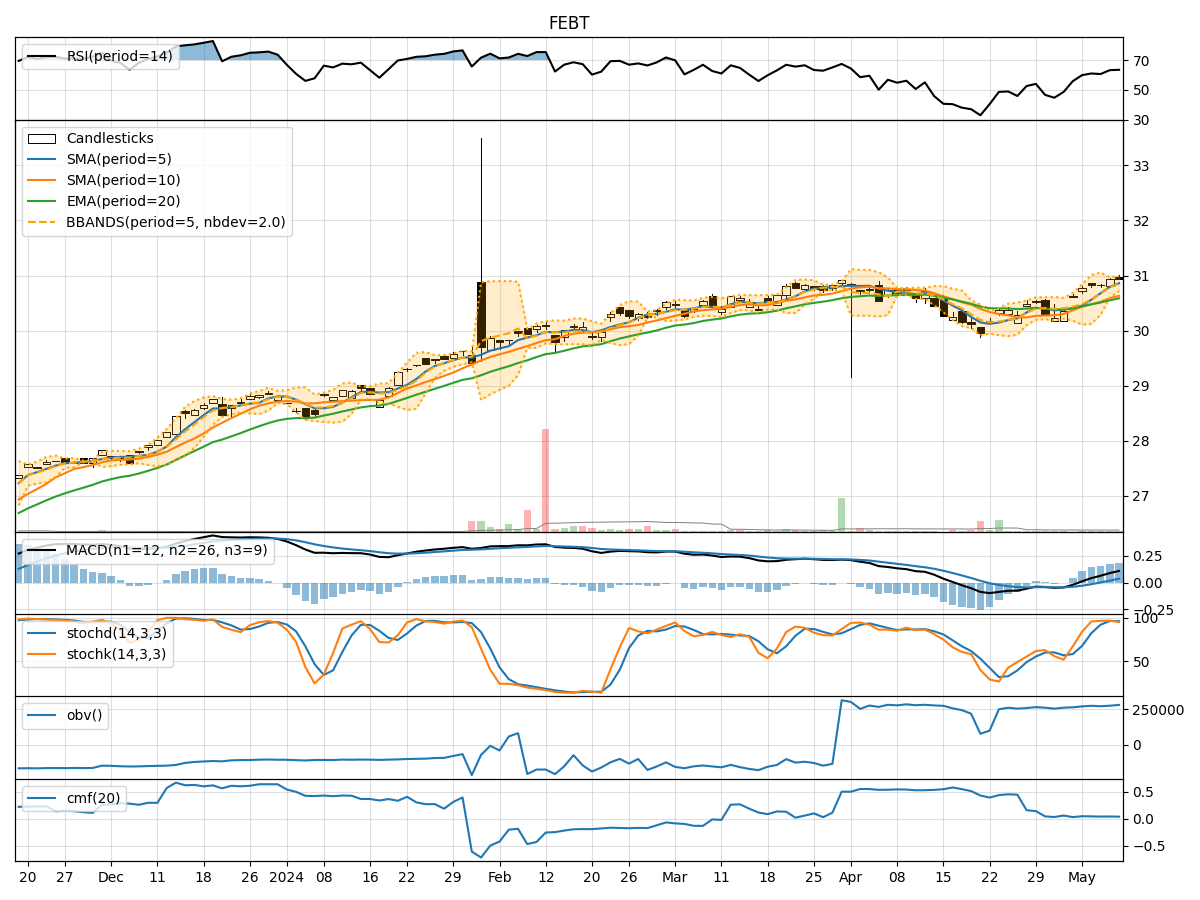
- Moving Averages (MA): The 5-day Moving Average (MA) has been relatively stable around the $31.25 mark, indicating a consistent price level.
- MACD: The Moving Average Convergence Divergence (MACD) has shown a slight positive trend, with the MACD line consistently above the signal line.
- EMA: The Exponential Moving Average (EMA) has been gradually increasing, suggesting a bullish sentiment in the short term.
Momentum Analysis:
- RSI: The Relative Strength Index (RSI) has been fluctuating but remains in the neutral zone, indicating a balanced momentum.
- Stochastic Oscillator: Both %K and %D have been declining, signaling a potential bearish momentum.
- Williams %R: The Williams %R is in the oversold territory, indicating a possible reversal in momentum.
Volatility Analysis:
- Bollinger Bands: The Bollinger Bands have been narrowing, suggesting decreasing volatility in the stock price.
- Bollinger %B: The %B indicator has been hovering around the middle range, indicating a neutral volatility outlook.
Volume Analysis:
- On-Balance Volume (OBV): The OBV has shown a slight decrease, indicating some selling pressure in the stock.
- Chaikin Money Flow (CMF): The CMF has been negative, suggesting a bearish money flow trend.
Key Observations:
- The trend indicators point towards a potential bullish sentiment in the short term, supported by the positive MACD and EMA trends.
- Momentum indicators, however, indicate a mixed outlook with RSI in a neutral zone but Stochastic Oscillator showing bearish signals.
- Volatility has been decreasing, which could lead to a period of consolidation or a potential breakout.
- The volume indicators suggest a slight increase in selling pressure, as indicated by the negative OBV and CMF values.
Conclusion:
Based on the analysis of the technical indicators, the next few days for FEBT could see sideways movement with a slight bearish bias. While the trend indicators suggest a bullish sentiment, the conflicting signals from momentum and volume indicators indicate a lack of strong conviction in the market. Traders should exercise caution and closely monitor key support and resistance levels for potential entry or exit points.