Technical Analysis of FEBW 2024-05-31
Overview:
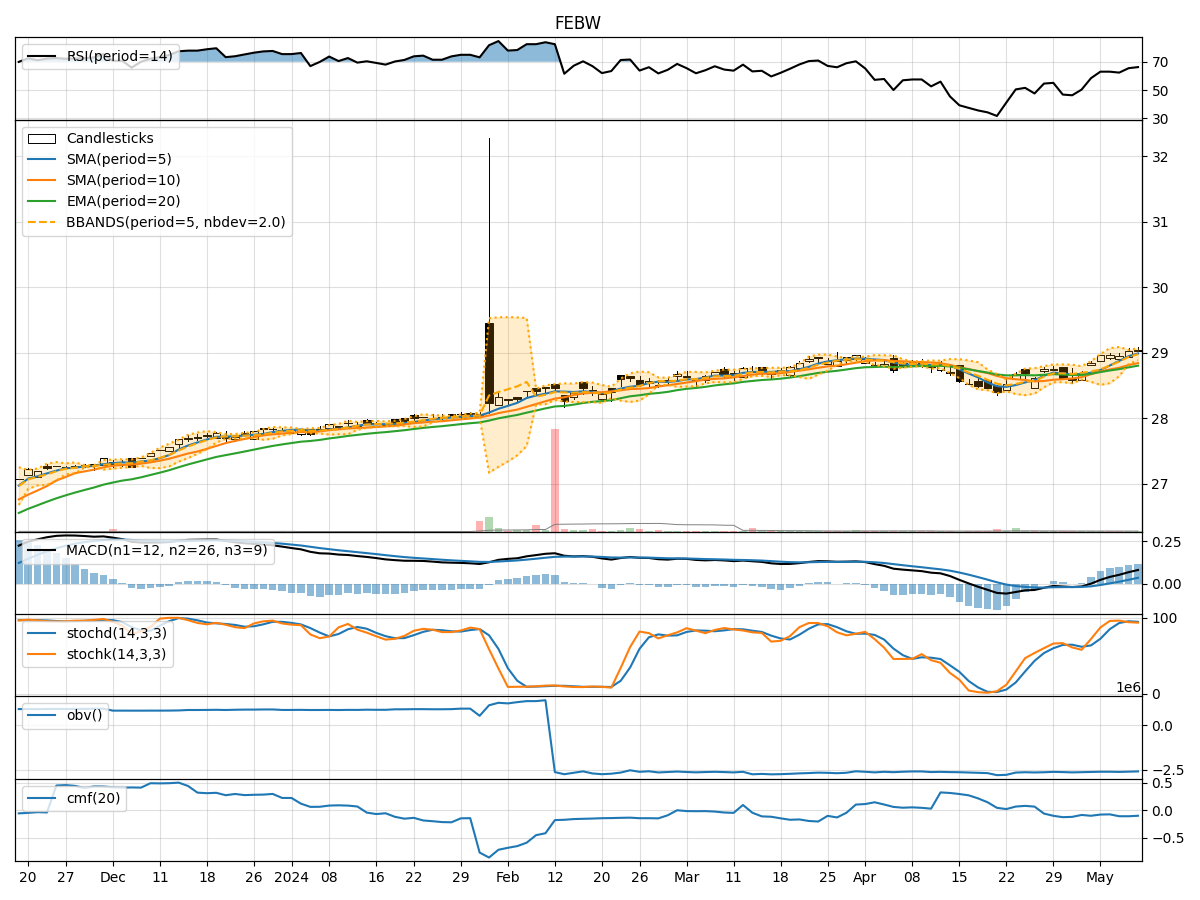
In analyzing the technical indicators for FEBW stock over the last 5 days, we will delve into the trend, momentum, volatility, and volume indicators to provide a comprehensive outlook on the possible stock price movement in the coming days. By examining these key indicators, we aim to offer valuable insights and recommendations for potential investors.
Trend Analysis:
- Moving Averages (MA): The 5-day Moving Average (MA) has been relatively stable around the closing prices, indicating a consistent trend.
- MACD: The Moving Average Convergence Divergence (MACD) has shown positive values, suggesting a bullish momentum in the stock.
- EMA: The Exponential Moving Average (EMA) has been gradually increasing, reflecting a positive trend in the stock price.
Momentum Analysis:
- RSI: The Relative Strength Index (RSI) has been fluctuating but generally staying within the neutral range, indicating a balanced momentum.
- Stochastic Oscillator: Both %K and %D values have been declining, signaling a potential bearish momentum.
- Williams %R: The Williams %R indicator has been moving towards oversold territory, suggesting a possible reversal in momentum.
Volatility Analysis:
- Bollinger Bands: The Bollinger Bands have been narrowing, indicating decreasing volatility in the stock price.
- Bollinger %B: The %B value has been fluctuating within a moderate range, reflecting stable price movements.
Volume Analysis:
- On-Balance Volume (OBV): The OBV has shown mixed movements, indicating indecision among investors regarding the stock.
- Chaikin Money Flow (CMF): The CMF has been positive, suggesting a potential inflow of money into the stock.
Key Observations:
- The trend indicators suggest a positive outlook with the MA and EMA showing upward trends.
- Momentum indicators are mixed, with RSI indicating neutrality while Stochastic and Williams %R hint at a potential bearish momentum.
- Volatility has been decreasing, indicating a possible period of consolidation.
- Volume indicators show mixed signals, with OBV reflecting indecision and CMF pointing towards positive money flow.
Conclusion:
Based on the analysis of the technical indicators, the stock price of FEBW is likely to experience sideways movement in the coming days. The trend indicators suggest a slightly bullish bias, while momentum indicators indicate a potential bearish reversal. The decreasing volatility and mixed volume signals further support the expectation of consolidation in the stock price. Investors should closely monitor key support and resistance levels for potential entry or exit points.