Technical Analysis of FEP 2024-05-31
Overview:
In analyzing the technical indicators for FEP stock over the last 5 days, we will delve into the trend, momentum, volatility, and volume indicators to provide a comprehensive outlook on the possible future stock price movement. By examining these key indicators, we aim to offer valuable insights and predictions for the upcoming trading days.
Trend Indicators:
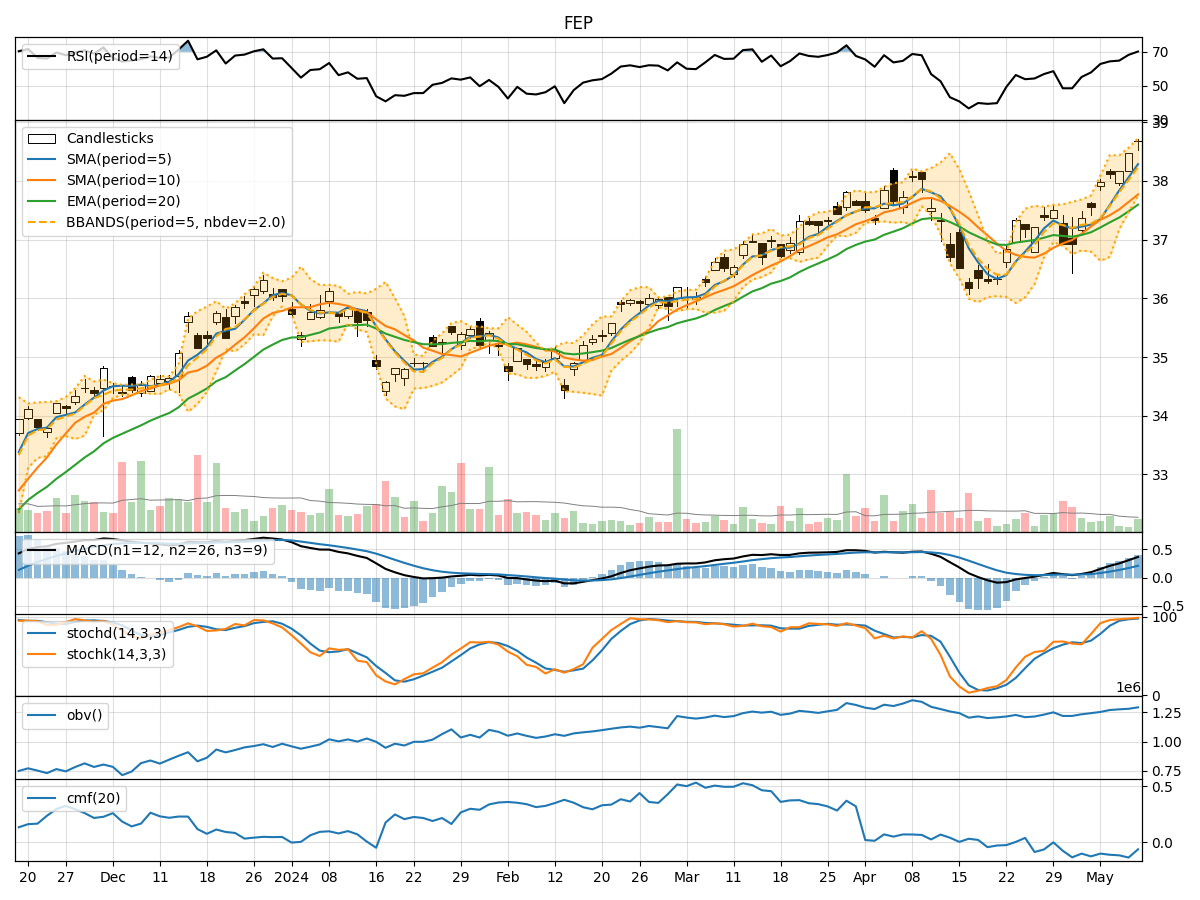
- Moving Averages (MA): The 5-day MA has been fluctuating around the closing prices, indicating short-term price trends. The SMA(10) and EMA(20) have shown a slight upward trend, suggesting a positive momentum in the medium to long term.
- MACD: The MACD line has been hovering around the signal line, with the MACD histogram showing minor fluctuations. This indicates a neutral stance in terms of momentum.
- Conclusion: The trend indicators suggest a neutral outlook with a slight bullish bias in the medium to long term.
Momentum Indicators:
- RSI: The RSI has been oscillating within the neutral zone, indicating a balanced momentum between buying and selling pressure.
- Stochastic Oscillator: Both %K and %D have been fluctuating, but not in extreme overbought or oversold territories.
- Conclusion: Momentum indicators point towards a neutral stance with no clear indication of a strong bullish or bearish momentum.
Volatility Indicators:
- Bollinger Bands (BB): The stock price has been trading within the bands, with the %B indicator showing fluctuations but not reaching extreme levels.
- Conclusion: Volatility indicators suggest a stable price movement with no significant spikes or drops expected in the near term.
Volume Indicators:
- On-Balance Volume (OBV): The OBV has shown mixed signals, indicating some divergence between price and volume movements.
- Chaikin Money Flow (CMF): The CMF has been negative, suggesting a slight selling pressure in the market.
- Conclusion: Volume indicators imply a slightly bearish sentiment with some divergence between price and volume movements.
Overall Conclusion:
Based on the analysis of trend, momentum, volatility, and volume indicators, the overall outlook for FEP stock in the next few days is neutral to slightly bearish. While the trend indicators show a potential for a bullish bias in the medium to long term, the momentum and volume indicators suggest a lack of strong buying pressure and some selling pressure in the market. The volatility indicators point towards a stable price movement without significant fluctuations expected.
Recommendation:
Considering the mixed signals from the technical indicators, it is advisable for investors to exercise caution and closely monitor the price movements in the coming days. It would be prudent to wait for more clarity in the market dynamics before making any significant trading decisions. Additionally, keeping an eye on any fundamental developments that could impact the stock price would be essential in navigating the current market conditions.