Technical Analysis of FLMX 2024-05-31
Overview:
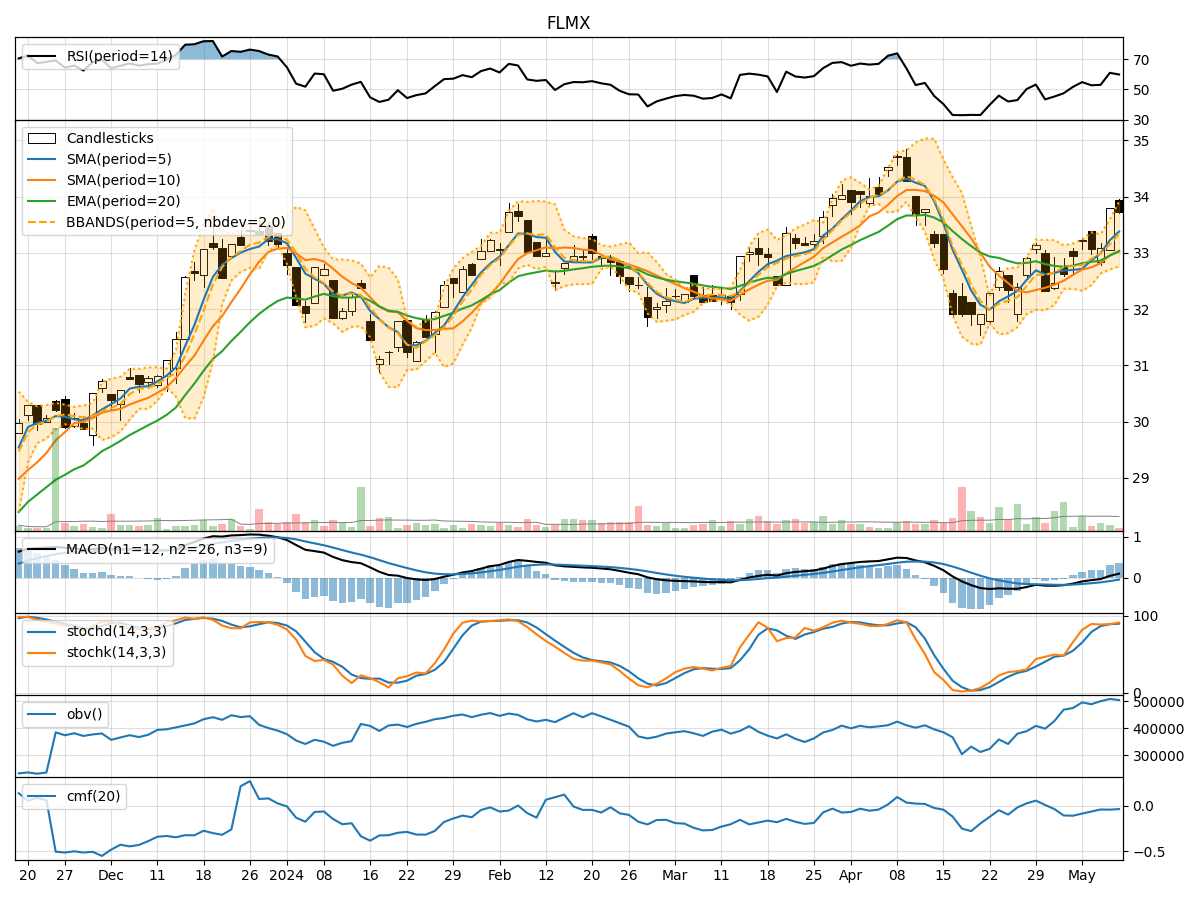
In analyzing the technical indicators for FLMX over the last 5 days, we will delve into the trend, momentum, volatility, and volume indicators to provide a comprehensive outlook on the possible stock price movement in the coming days.
Trend Analysis:
- Moving Averages (MA): The 5-day MA has been consistently below the closing prices, indicating a short-term downtrend.
- MACD: The MACD line has been below the signal line, suggesting a bearish momentum.
- EMA: The exponential moving average has been declining, further supporting the bearish trend.
Momentum Analysis:
- RSI: The Relative Strength Index has been hovering around the oversold territory, indicating a potential reversal or consolidation.
- Stochastic Oscillator: Both %K and %D have been low, signaling potential oversold conditions.
- Williams %R: The indicator has been in the oversold region, suggesting a possible reversal.
Volatility Analysis:
- Bollinger Bands: The stock price has been trading below the lower Bollinger Band, indicating oversold conditions.
- Bollinger %B: The %B indicator has been below 0.2, signaling potential undervaluation.
- Average True Range (ATR): The ATR has been relatively low, indicating decreased volatility.
Volume Analysis:
- On-Balance Volume (OBV): The OBV has been negative, suggesting distribution and selling pressure.
- Chaikin Money Flow (CMF): The CMF has been negative, indicating outflows and bearish sentiment.
Key Observations:
- The stock is currently in a downtrend based on moving averages and MACD.
- Momentum indicators suggest the stock may be oversold and due for a potential reversal.
- Volatility is low, indicating a lack of significant price movements.
- Volume indicators show selling pressure and bearish sentiment.
Conclusion:
Based on the analysis of the technical indicators, the next few days for FLMX are likely to see a potential reversal or consolidation in the stock price. The oversold conditions indicated by momentum indicators, coupled with low volatility, may lead to a period of stabilization or a slight uptrend. However, the overall trend remains bearish, so caution is advised. Expect a possible short-term bounce or sideways movement before a clearer trend emerges.