Technical Analysis of FLSP 2024-05-31
Overview:
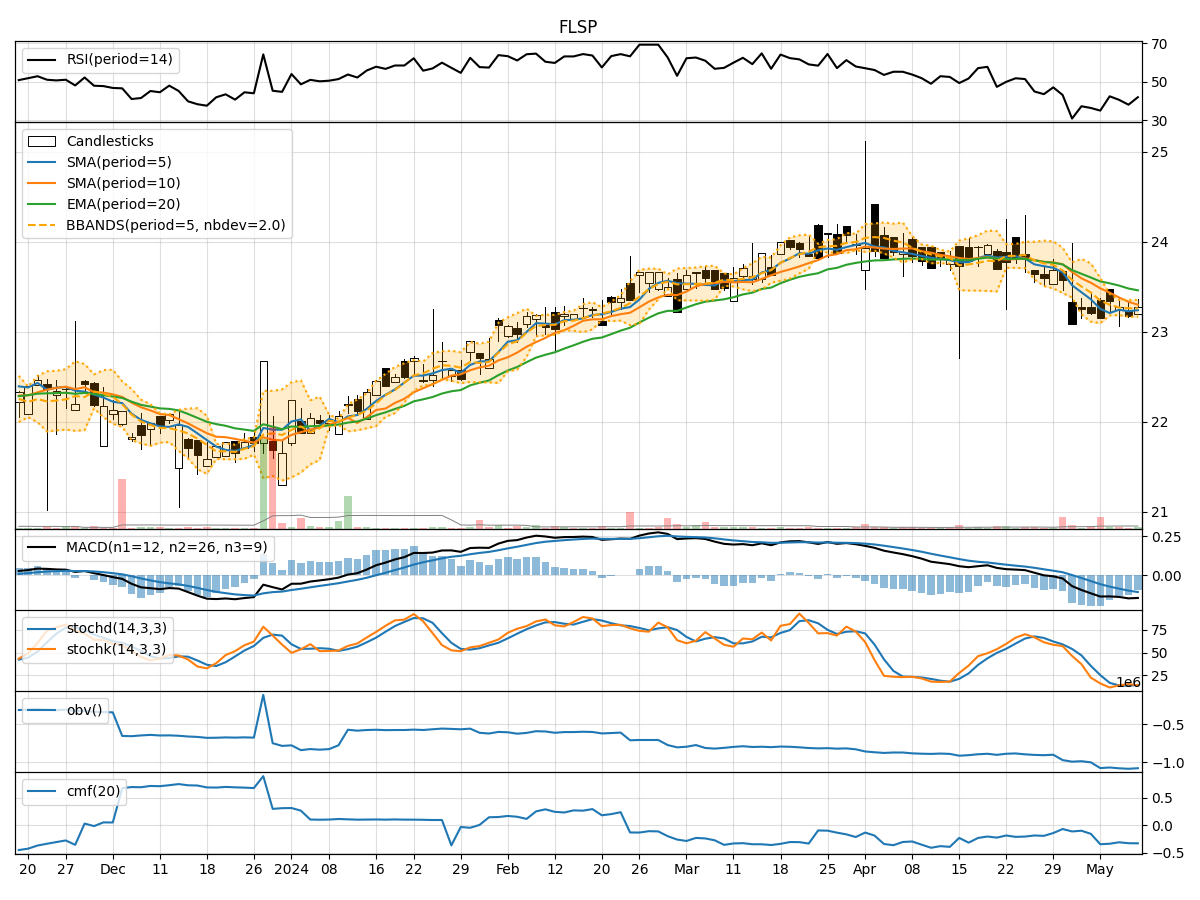
In analyzing the technical indicators for FLSP over the last 5 days, we will delve into the trend, momentum, volatility, and volume indicators to provide a comprehensive outlook on the possible stock price movement in the coming days. By examining these key indicators, we aim to offer valuable insights and predictions for potential investors.
Trend Analysis:
- Moving Averages (MA): The 5-day Moving Average (MA) has been fluctuating around the closing prices, indicating a lack of clear trend direction.
- MACD: The Moving Average Convergence Divergence (MACD) has shown negative values, suggesting a bearish momentum in the short term.
- EMA: The Exponential Moving Average (EMA) has been relatively stable, indicating a neutral trend.
Momentum Analysis:
- RSI: The Relative Strength Index (RSI) has been oscillating within the neutral zone, indicating a lack of strong momentum.
- Stochastic Oscillator: Both %K and %D values have been fluctuating, showing indecision in momentum.
- Williams %R: The Williams %R has been hovering around oversold and neutral levels, reflecting mixed momentum signals.
Volatility Analysis:
- Bollinger Bands: The Bollinger Bands have shown widening in recent days, indicating increased volatility.
- Bollinger %B: The %B indicator has been fluctuating within the bands, suggesting potential price reversals.
- Average True Range (ATR): ATR values have been relatively stable, indicating consistent volatility levels.
Volume Analysis:
- On-Balance Volume (OBV): The OBV has shown a slight decline, suggesting selling pressure in the stock.
- Chaikin Money Flow (CMF): The CMF has been negative, indicating a lack of buying interest and potential bearish sentiment.
Key Observations:
- The trend indicators suggest a neutral to slightly bearish outlook.
- Momentum indicators show mixed signals with no clear direction.
- Volatility has increased, indicating potential price fluctuations.
- Volume indicators point towards selling pressure and lack of buying interest.
Conclusion:
Based on the analysis of the technical indicators, the stock price of FLSP is likely to experience further downside movement in the coming days. The overall trend is bearish, supported by the negative MACD values and lack of strong buying momentum. Increased volatility and selling pressure, as indicated by the Bollinger Bands and OBV, further support this bearish view. Investors should exercise caution and consider potential short-term downside risks in their trading strategies.