Technical Analysis of FNOV 2024-05-31
Overview:
In analyzing the technical indicators for FNOV stock over the last 5 days, we will delve into the trend, momentum, volatility, and volume indicators to provide a comprehensive outlook on the possible stock price movement in the coming days. By examining these key indicators, we aim to offer valuable insights and predictions to guide your investment decisions.
Trend Analysis:
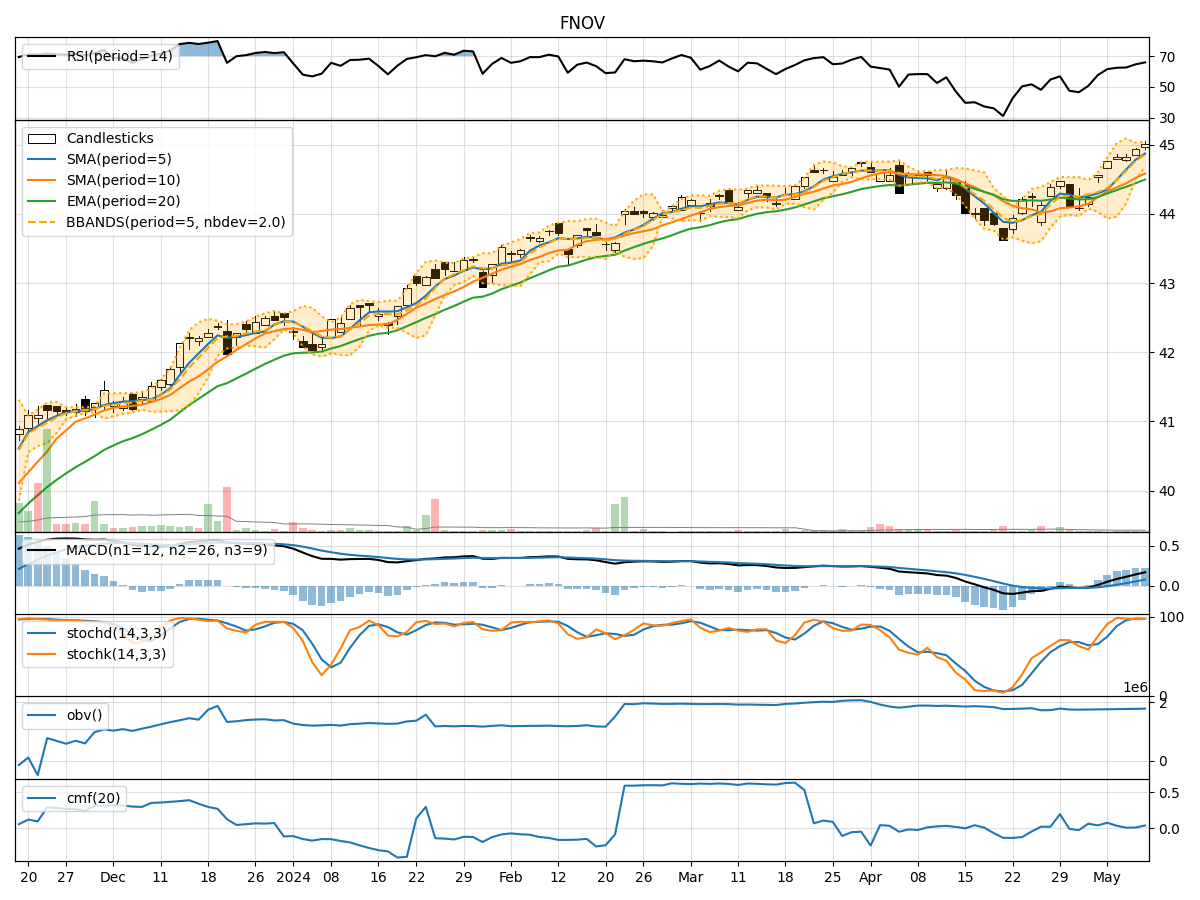
- Moving Averages (MA): The 5-day Moving Average (MA) has been fluctuating around the closing prices, indicating short-term price trends. The Simple Moving Average (SMA) and Exponential Moving Average (EMA) have shown a slight upward trend, suggesting a potential bullish sentiment.
- Moving Average Convergence Divergence (MACD): The MACD and Signal Line have been relatively stable, with the MACD line slightly above the Signal Line. This indicates a potential bullish momentum in the stock price.
Momentum Analysis:
- Relative Strength Index (RSI): The RSI has been fluctuating but generally staying within the neutral range, indicating a balanced momentum between buying and selling pressure.
- Stochastic Oscillator: Both %K and %D lines of the Stochastic Oscillator have been declining, suggesting a weakening momentum in the stock price.
- Williams %R (Willams %R): The Williams %R has been fluctuating in the oversold territory, indicating a potential reversal in the stock price.
Volatility Analysis:
- Bollinger Bands (BB): The Bollinger Bands have shown narrowing volatility, with the stock price approaching the lower band. This could indicate a potential consolidation phase or a period of reduced volatility.
- Bollinger Band Percentage (BBP): The BBP has been decreasing, suggesting a compression in price movement and a possible breakout in the near future.
Volume Analysis:
- On-Balance Volume (OBV): The OBV has been declining, indicating a decrease in buying volume compared to selling volume.
- Chaikin Money Flow (CMF): The CMF has shown some positive values, suggesting that money flow into the stock has been relatively stable over the past few days.
Conclusion:
Based on the analysis of the technical indicators, the stock is likely to experience sideways movement in the next few days. The trend indicators point towards a potential bullish sentiment, supported by the moving averages and MACD. However, the momentum indicators suggest a weakening momentum, especially with the Stochastic Oscillator showing a decline. The volatility indicators indicate a potential consolidation phase, while the volume indicators show a decrease in buying volume.
Therefore, it is recommended to exercise caution and closely monitor the stock price for any potential breakout or reversal signals. Consider setting appropriate stop-loss levels and wait for clearer signals before making significant trading decisions.