Technical Analysis of FNY 2024-05-31
Overview:
In analyzing the technical indicators for FNY stock over the last 5 days, we will delve into the trend, momentum, volatility, and volume indicators to provide a comprehensive outlook on the possible stock price movement in the coming days. By examining these key aspects, we aim to offer valuable insights and predictions for potential investors.
Trend Analysis:
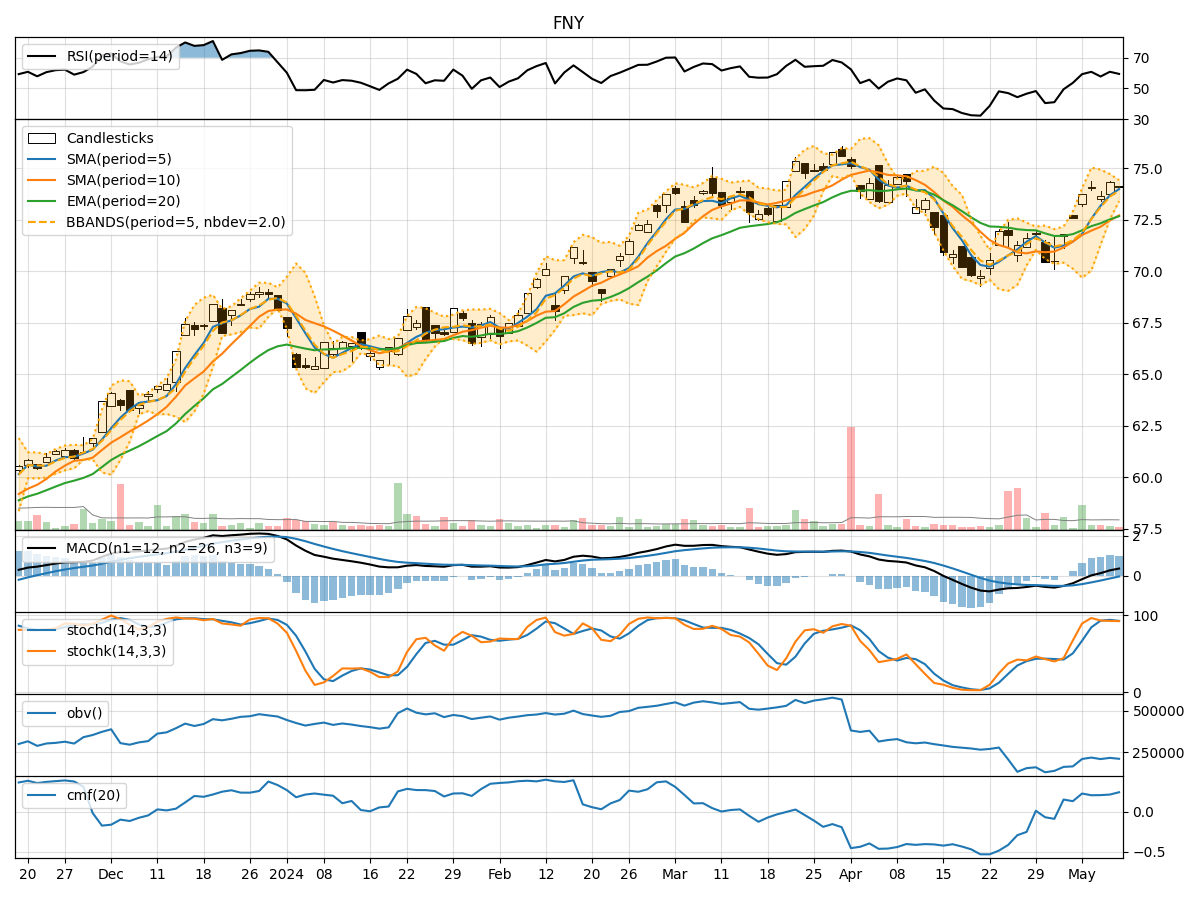
- Moving Averages (MA): The 5-day MA has been gradually decreasing, indicating a short-term bearish trend.
- MACD: The MACD line has been consistently positive, but the MACD Histogram has been decreasing, suggesting a weakening bullish momentum.
Momentum Analysis:
- RSI: The RSI has been declining, indicating a loss of bullish strength.
- Stochastic Oscillator: Both %K and %D have been decreasing, signaling a potential bearish crossover.
Volatility Analysis:
- Bollinger Bands (BB): The stock price has been trading within the bands, with the bands narrowing, indicating decreasing volatility.
Volume Analysis:
- On-Balance Volume (OBV): The OBV has been decreasing, suggesting a potential distribution phase.
- Chaikin Money Flow (CMF): The CMF has been declining, indicating a decrease in buying pressure.
Key Observations:
- The stock is currently in a short-term bearish trend based on moving averages and momentum indicators.
- Volatility has been decreasing, potentially leading to a period of consolidation.
- Volume indicators suggest a weakening buying pressure and a possible distribution phase.
Conclusion:
Based on the analysis of the technical indicators, the next few days' possible stock price movement for FNY is likely to be bearish. The stock is showing signs of weakness in trend, momentum, and volume, indicating a potential downward movement. Traders and investors should exercise caution and consider short-term selling opportunities or wait for a clearer bullish signal before entering new long positions.