Technical Analysis of FPFD 2024-05-31
Overview:
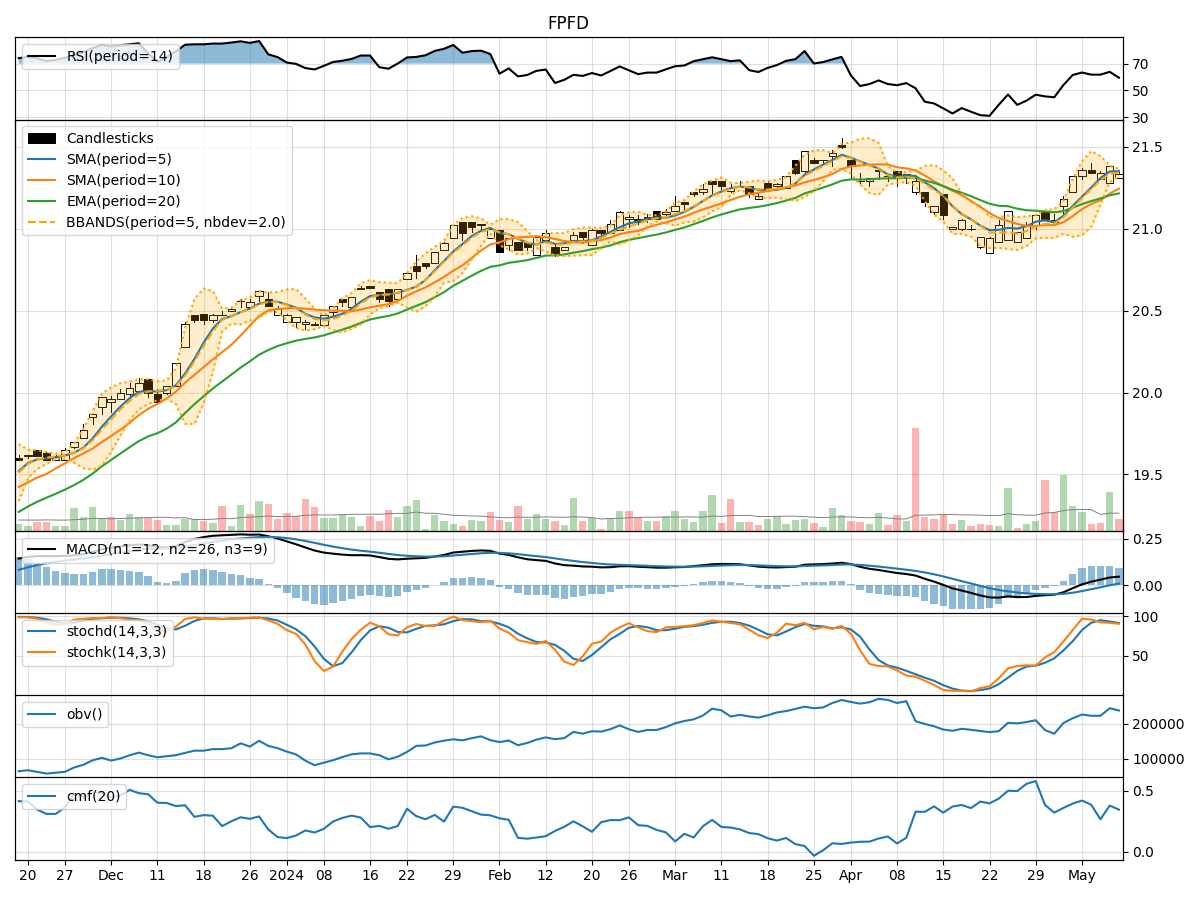
In analyzing the technical indicators for FPFD over the last 5 days, we will delve into the trend, momentum, volatility, and volume indicators to provide a comprehensive outlook on the possible stock price movement in the coming days.
Trend Analysis:
- Moving Averages (MA): The 5-day MA has been relatively stable around the current price, indicating a neutral trend.
- MACD: The MACD line has shown slight fluctuations but remains close to the signal line, suggesting a lack of strong momentum in either direction.
- EMA: The EMA has been gradually increasing, indicating a potential bullish sentiment in the short term.
Momentum Analysis:
- RSI: The RSI has been fluctuating around the 50 level, indicating a lack of strong momentum in either direction.
- Stochastic Oscillator: Both %K and %D have been moving within a range, suggesting a neutral momentum.
- Williams %R: The indicator has shown oversold conditions on some days but lacks a clear trend.
Volatility Analysis:
- Bollinger Bands (BB): The bands have been relatively narrow, indicating low volatility in the stock price.
- Bollinger %B: The %B has been hovering around the middle line, suggesting a lack of extreme price movements.
- Bollinger Band Width: The band width has been narrow, indicating a period of consolidation.
Volume Analysis:
- On-Balance Volume (OBV): The OBV has shown a slight increase, indicating some accumulation by investors.
- Chaikin Money Flow (CMF): The CMF has been positive, suggesting buying pressure in the stock.
Conclusion:
Based on the analysis of the technical indicators, the stock price of FPFD is likely to experience sideways movement in the next few days. The lack of strong trends in the trend and momentum indicators, coupled with low volatility and steady volume accumulation, indicates a period of consolidation. Traders may expect the stock price to trade within a narrow range without significant upward or downward movements. It is advisable to closely monitor key support and resistance levels for potential breakout opportunities in the future.